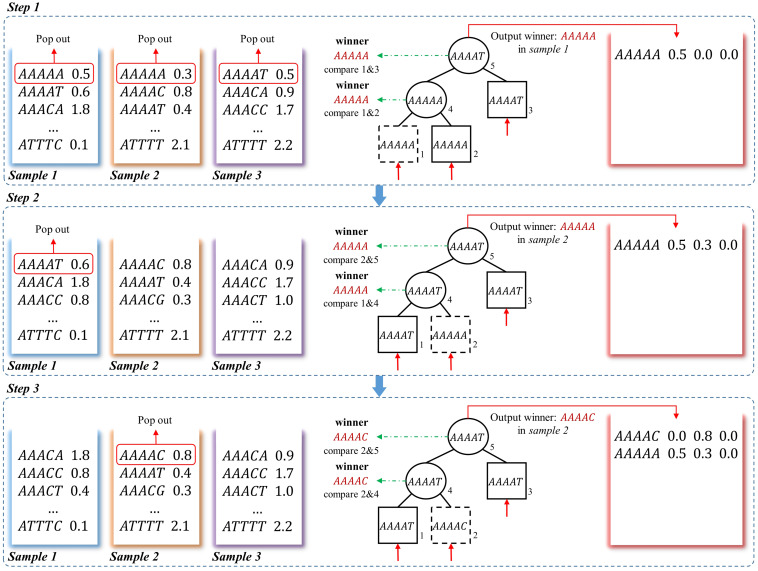
FIGURE 3.
A schematic example to obtain frequency matrix using loser-tree algorithm. Using a three-sample dataset as an example, in step 1, the first k-mers of the three frequency vectors are pop-out as the leaves of a loser tree. Because “AAAAA” = “AAAAA,” the “AAAAA” in sample 1 is randomly picked as the winner and the other one is kept as the loser in the Parent node. The winner “AAAAA” is then compared to another leaf node “AAAAG,” the larger one “AAAAG” is the loser and kept as root node. The winner “AAAAA” and its corresponding frequency in sample 1 is written to the frequency matrix. In step 2, the second k-mer “AAAAT” in sample 1 is pop-out to replace the previous winner node “AAAAA.” “AAAAT” is compared to Parent node “AAAAA” in second level, and the “AAAAA” in sample 2 is the winner and the Parent node of this branch is updated as the loser “AAAAT.” Then the winner “AAAAA” is still the winner when compared to root node “AAAAG”, so the corresponding frequency of “AAAAA” in sample 2 is updated in the frequency matrix. In step 3, the winner is “AAAAC,” which means there is no other samples containing k-mer “AAAAA.” And the winner and its corresponding frequency is written to the frequency matrix.

