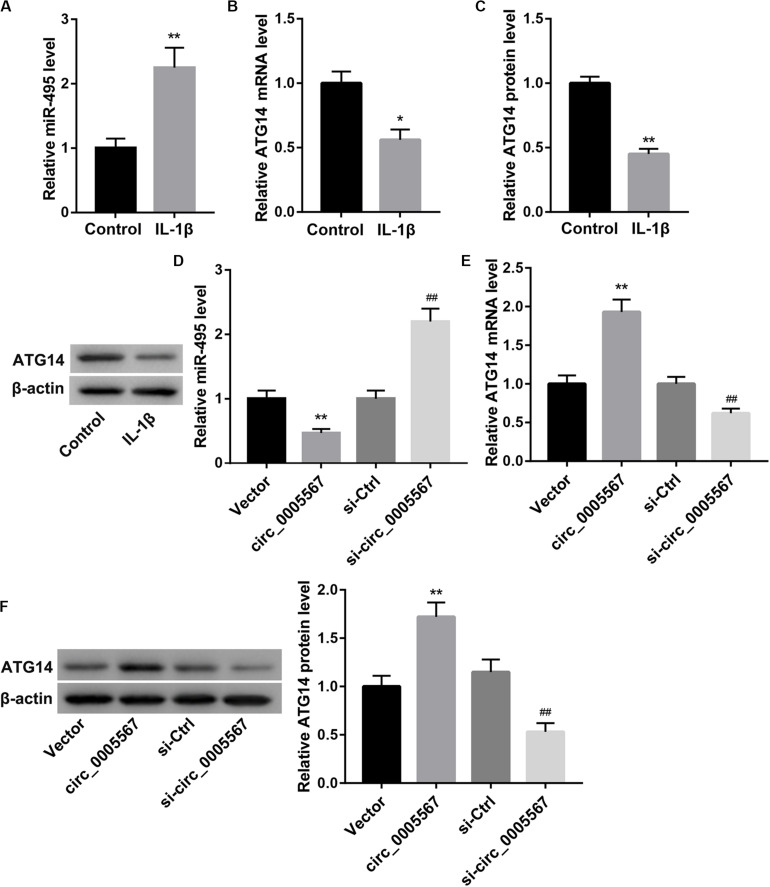
FIGURE 3.
Circ_0005567 negatively regulated miR-495 expression but positively regulated ATG14 expression. (A) MiR-495 expression examined by qRT-PCR analysis, (B) ATG14 mRNA level determined by qRT-PCR analysis, and (C) ATG14 protein level examined by western blot in PBS (control)- or IL-1β-treated chondrocytes. (D) MiR-495 expression examined by qRT-PCR analysis, (E) ATG14 mRNA level determined by qRT-PCR analysis, and (F) ATG14 protein level examined by western blot in chondrocytes transfected with circ_0005567 overexpression vector, empty vector, si-circ_0005567, or si-Ctrl in the presence of IL-1β. The data are expressed as mean ± standard deviation from three independent experiments. *P < 0.05, **P < 0.01, versus the Control or Vector group; ##P < 0.01, versus the si-Ctrl group.

