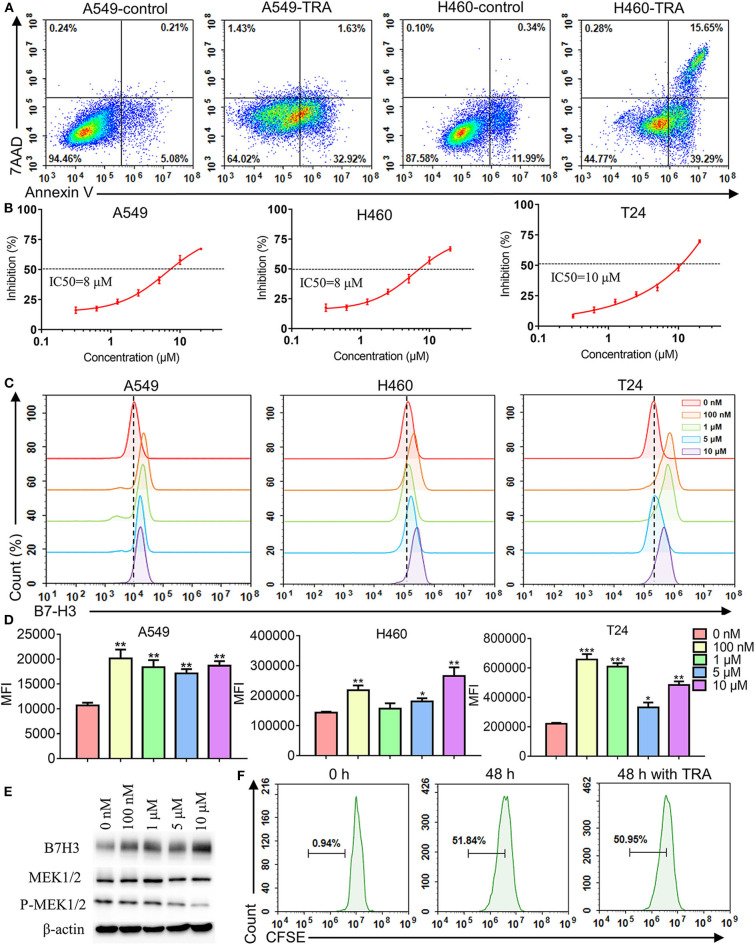
Figure 2.
Effects of MEK inhibitor trametinib in A549, H460, T24, and human T cells. (A) Apoptosis detection with annexin V-FITC/7AAD double staining by flow cytometry. A549 and H460 cells were cultured with 10 μM trametinib for 48 h. (B) Inhibition rate of A549, H460, and T24 cells after exposure to trametinib with various concentrations. After 48 h of treatment, inhibition rate was measured using Cell Counting Kit-8 assays. (C) B7-H3 expression after trametinib treatment with indicated concentrations by flow cytometry. Histograms represent the measured fluorescence of cells incubated with the B7-H3 antibody. (D) Histogram of the mean fluorescence intensity. (E) Western blot analysis of B7-H3, MEK, and P-MEK expression in A549 cells after trametinib treatment with indicated concentrations. Expression of β-actin was used as an internal control. (F) Proliferation (CFSE dilution assay) of human T cells after 48 h of treatment with 1 μM trametinib by flow cytometry. Histograms represent the measured fluorescence of cells incubated with CFSE. *P < 0.05, **P < 0.01, ***P < 0.001.

