Figure 3.
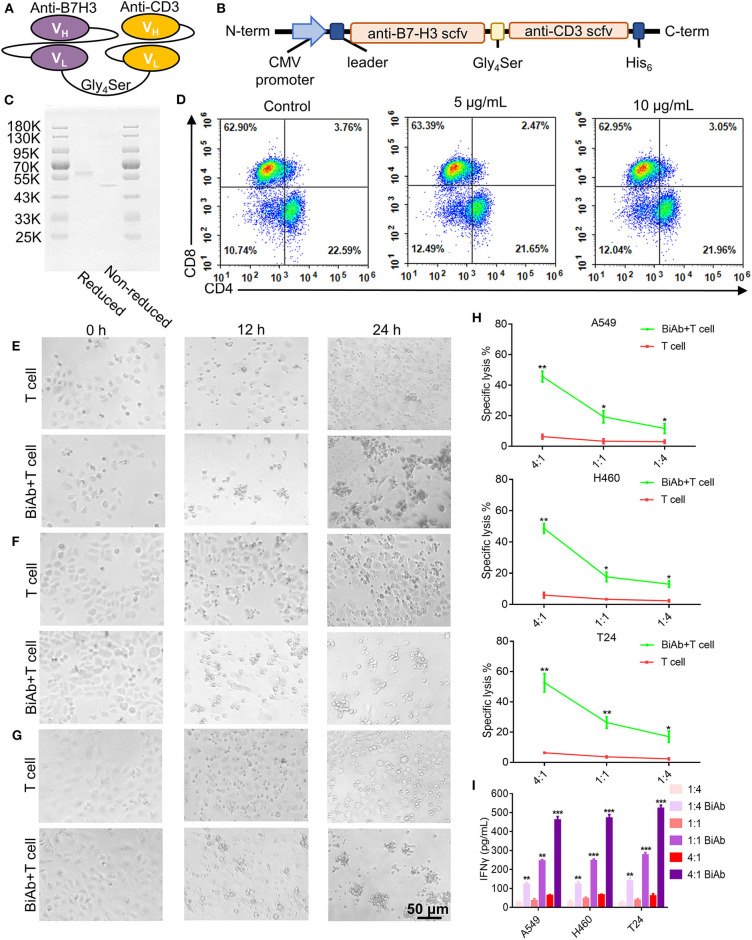
Construction, characterization and cytotoxicity of B7-H3 × CD3 BiAb. (A) The schematic representation of B7-H3 × CD3 BiAb. (B) Schematic diagram of B7-H3 × CD3 BiAb expression vector. (C) SDS-PAGE analysis of B7-H3 × CD3 BiAb. The BiAb was run on reducing and non-reducing SDS-PAGE gels. (D) Dot plot diagram of flow cytometry showing CD4+ and CD8+ percentage of human T cells after 5 or 10 μg/mL B7-H3 × CD3 BiAb treatment for 48 h. (E–G) Morphology of tumor cells after co-culture with human T cells. A549 (E), H460 (F), or T24 (G) cell lines were co-cultured with T cells for 12 or 24 h at a ratio of E:T = 4:1. Group “BiAb + T cell” was treated with B7-H3 × CD3 BiAb at a concentration of 5 μg/mL. Scale bar, 50 μm. (H) 51Cr-release assays of T cells against A549, H460 and T24 cell lines with 5 μg/mL B7-H3 × CD3 BiAb in different E:T ratios. (I) Quantification of IFN-γ by ELISA in the supernatant 24 h after co-culture of T cells with A549, H460, or T24 cell lines at different E:T ratio. Group “BiAb” was treated with B7-H3 × CD3 BiAb at a concentration of 5 μg/mL. *P < 0.05, **P < 0.01, ***P < 0.001.

