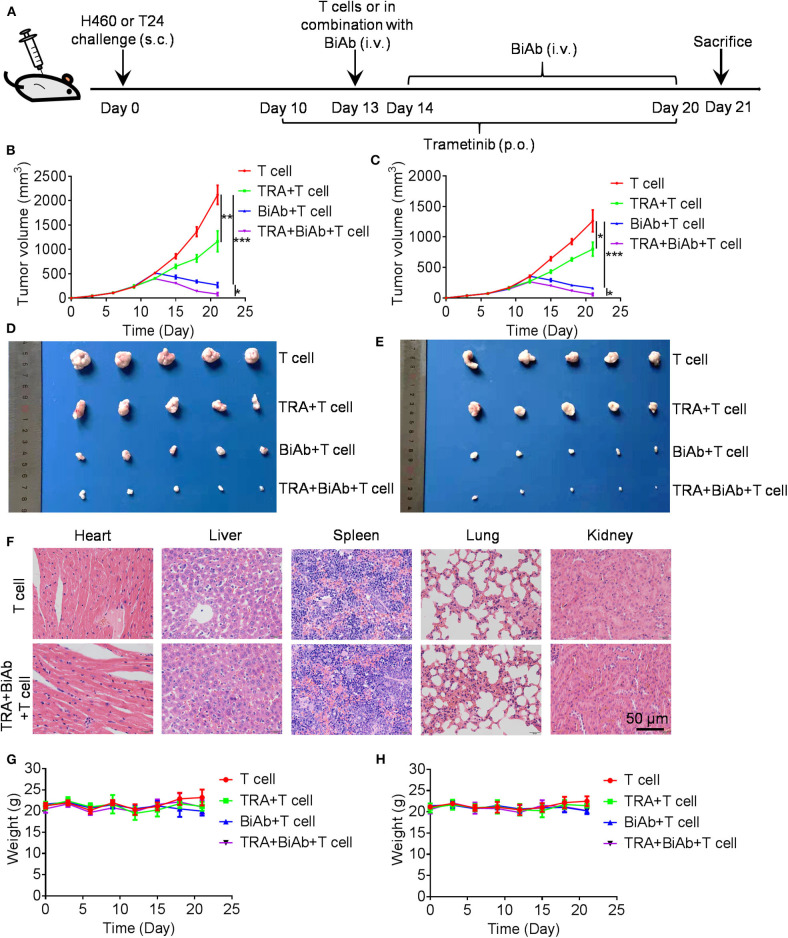
Figure 5.
Antitumor activity by B7-H3 × CD3 BiAb in combination with trametinib in vivo. (A) Experiment design scheme. (B,C) Tumor growth curves from H460 (B) and T24 (C) mice models treated with T cell, T cell with trametinib, the BiAb or the BiAb combined with trametinib. Tumor volume measurements were recorded every 3 days. (D,E) Tumors from H460 (D) and T24 (E) mice models on day 21 are shown. (F) H&E staining images of liver, spleen, kidney, heart, and lung in H460 mice models. (G,H) Bodyweight of H460 (G) and T24 (H) mice treated with T cell, T cell with trametinib, the BiAb or the BiAb combined with trametinib. Bodyweight measurements were recorded every 3 days.

