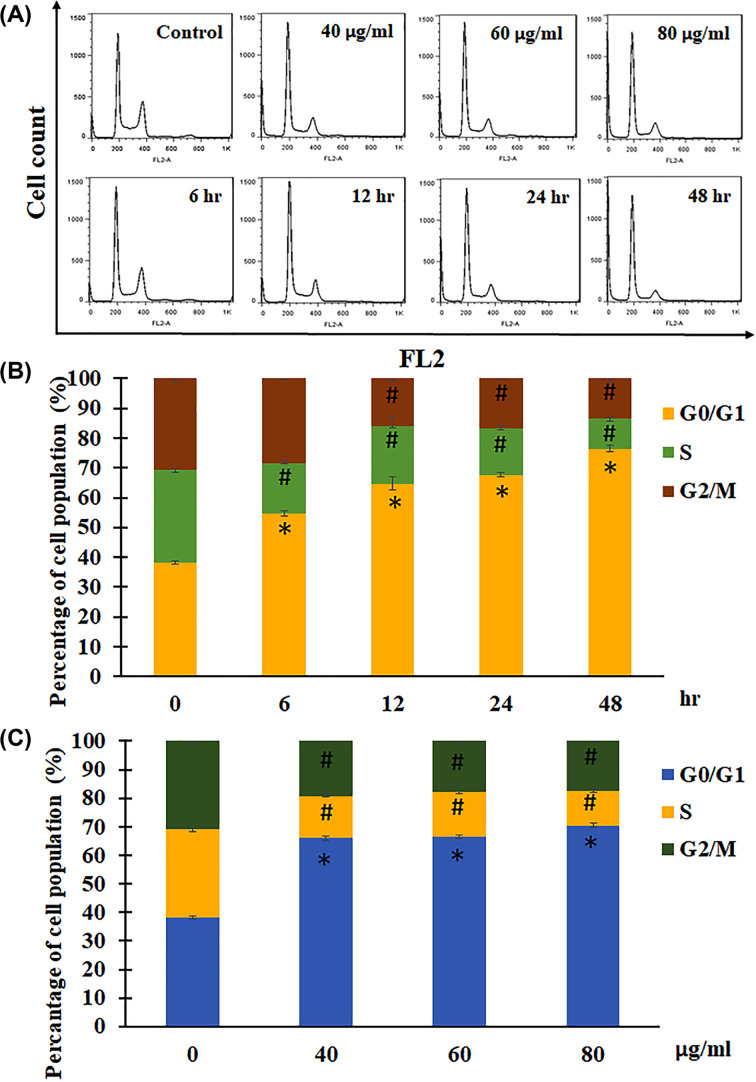
Figure 2. Flow cytometric analysis of cell cycle in OECM-1 cells.
OECM-1 cells were treated with JCo for the allocated time period, stained with PI, and analyzed using flow cytometry. (A) Cell cycle distribution, (B and C) cell cycle statistical data. *, #: It was significant difference increasing or decreasing between treating and non-treating groups (P<0.05).

