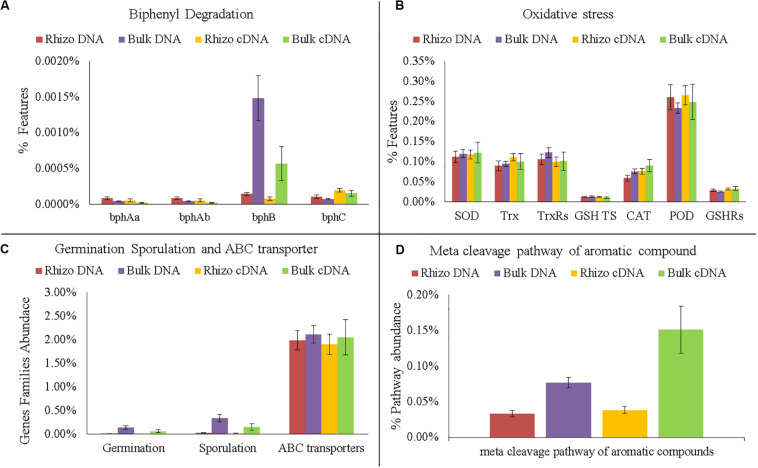
FIGURE 7.
Comparison of functional gene analyses on DNA and cDNA samples. (A) Number of gene families encode enzymes of the biphenyl degradation: biphenyl 2,3-dioxygenase (bphAa, bphAb); cis-2,3-dihydro-2,3-dihydroxybiphenyl dehydrogenase (bphB); 2,3-dihydroxybiphenyl 1,2-dioxygenase (bphC). (B) Number of gene families encoding enzymes and proteins related to oxidative stress: superoxide dismutase (SOD); thioredoxin (Trx); thioredoxin reductase (TrxRs); glutathione transport system (GSH TS); Catalase (CAT); peroxidase (POD); glutathione reductase (GSHRs). (C) Number of Gene families related to germination, sporulation and ABC transporters. (D) Abundance of meta cleavage pathway of aromatic compounds.

