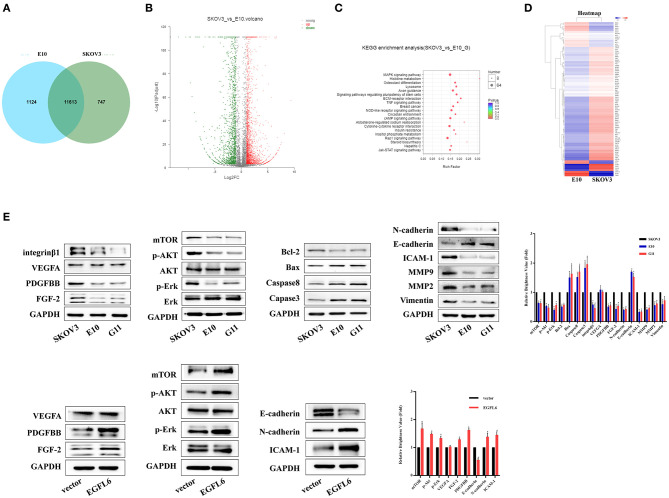
Figure 6.
Transcriptome analysis of ovarian cancer cells with EGFL6 knockout. (A) Venn diagram shows the number of co-expressed genes and unique genes expressed by SKOV3 and E10, respectively. (B) Scatter plot of co-expressed genes between SKOV3 and E10. (C) KEGG enrichment of scatter plot. (D) Cluster analysis of differential gene expression pattern. (E) Western blot assays of signal pathways related to proliferation, apoptosis, migration, invasion, and angiogenesis in the cancer cells with EGFL6 knockout. *p < 0.05 were considered statistically significant.

