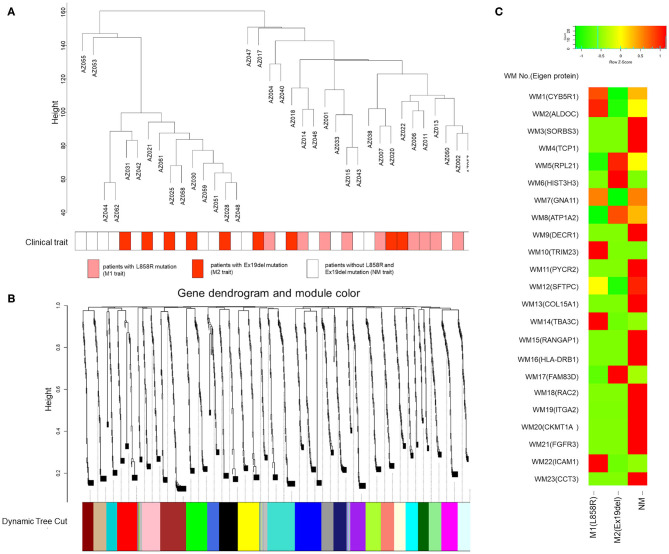
Figure 3.
Gene modules identified by weighted gene coexpression network analysis (WGCNA). (A) Patient clustering according to mutant protein abundance with the EGFR mutation profiles. The red, orange, and white cells below the patients indicate the EGFR mutation types, i.e., Ex19del mutation, L858R mutation, and no EGFR mutation, respectively. (B) Gene dendrogram obtained by clustering dissimilarity according to topological overlap with the corresponding module. The colored rows correspond with the 23 modules identified by dissimilarity according to topological overlap. (C) Heat map for the proteome abundance of eigen proteins in the 23 mutant protein modules by WGCNA. The rows and columns are the mutant protein modules and EGFR mutation types, respectively. The red and green colors indicate high and low mutant protein abundances, respectively, of an eigen protein in a mutant protein module. The names of the eigen proteins in the protein modules are indicated in parentheses.

