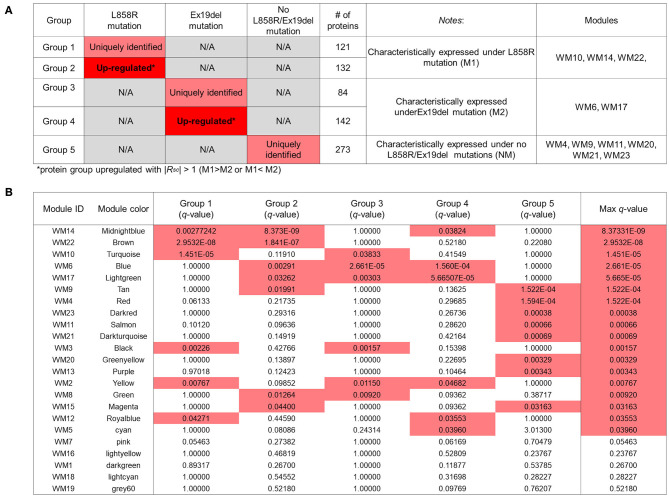
Figure 4.
Overlapping proteins unique to the clinical traits and/or upregulated under the M1 or M2 traits and those from weighted gene coexpression network analysis (WGCNA). (A) Results of identified proteins and spectral-counting based semiquantitative comparison. Each row represents results for each protein group. The red and pink cells in the “L858R mutation” and “Ex19del mutation” columns indicate that the proteins in the group are uniquely expressed and significantly upregulated, respectively, in samples with the mutations [Upregulated with |Rsc| > 1 (M1 > M2 or M1 < M2)]. The fourth column shows the number of proteins in each protein group. The fifth column provides notes for each protein group. The WGCNA modules with significant overlap with each protein group are listed in the sixth column (“Modules” column). (B) Overlap in proteins between the groups by the protein expression profiles and the modules by WGCNA. Each row in the embedded table represents overlap analysis results for each module. The first and second columns in the table represent module ID and color name of the module. The third through eighth columns indicate the q-values for overlap in proteins between a module by WGCNA and the five protein groups. In the six columns, significant q-values are highlighted in red. The eighth column represents the value of the most significant q-value (max q-value) in each module. The 18 modules with max q-values <0.05 are listed in order.

