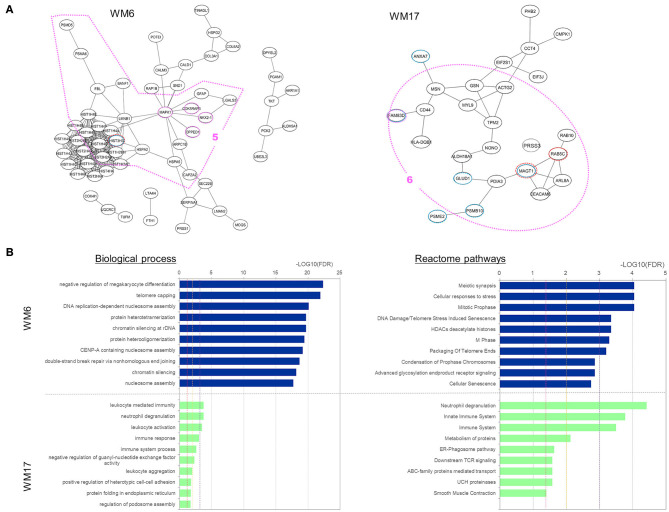
Figure 6.
Analysis results for three protein modules (WM6 and WM17) that overlap with proteins uniquely expressed and upregulated under the Ex19del mutation. (A) Protein interaction networks for the three WGCNA modules. Dotted circle nodes in blue and red represent eigen-proteins and hub proteins, respectively, for each module. (B) Pathway enrichment analysis using Go Biological Process and Reactome pathway databases for the three protein modules. The vertical axis shows the pathway names, and the bars on the horizontal axis represent the –log10 (p-value) of the corresponding pathway. The different colors of the bars are following the corresponding modules. Dashed lines in red, orange, and magenta indicate p < 0.05, <0.01, and <0.001, respectively.

