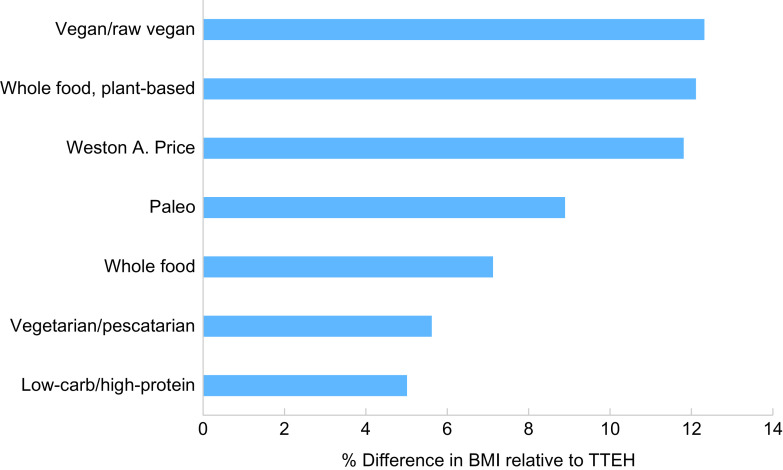
Fig. 2.
Comparison of overall adjusted mean BMI*,† (percent differences) by diet group compared with TTEH. *n 8226. Excludes those with missing or invalid BMI (n 785 due to missing or implausible height or weight data) and (n 8) prefer not to answer responses to time on current diet; BMI means are adjusted for age, sex, US ‘residency’, time on diet and current medication use for the following conditions: high cholesterol, high blood pressure, type 2 diabetes, cancer and gastrointestinal. †Adjusted for Tukey’s Honestly Significant Differences. All differences were statistically significant (P < 0·001)

