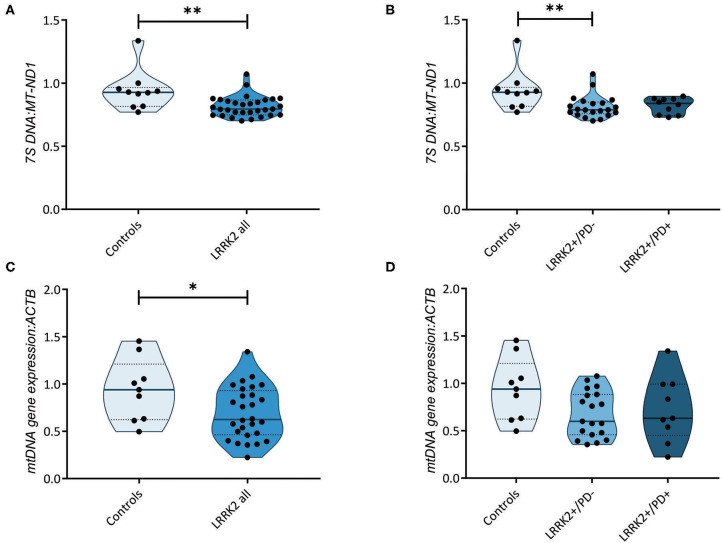
Figure 3.
Transcription of the mitochondrial genome. (A) Mitochondrial DNA (mtDNA) transcription-associated 7S DNA normalized to MT-ND1 in controls (n = 10) and leucine-rich repeat kinase-2 (LRRK2) G2019S mutation carriers (n = 31). Mann–Whitney test: p = 0.003. (B) 7S DNA:MT-ND1 ratios in controls (n = 10) and non-manifesting (LRRK2+/PD−, n = 21) and manifesting carriers (LRRK2+/PD+, n = 10) of the G2019S mutation in LRRK2. Kruskal–Wallis test and Dunn's post-hoc test: controls vs. LRRK2+/PD−, p = 0.009; controls vs. LRRK2+/PD+, p = 0.14; LRRK2+/PD− vs. LRRK2+/PD+, p > 0.99. (C) Mitochondrial gene expression derived from averaging the mRNA levels of MT-ND1, MT-ND4, MT-CO1, and MT-CYTB in controls (n = 9) and LRRK2 G2019S mutation carriers (n = 28). Mann–Whitney test: p = 0.04. (D) MtDNA gene expression in control (n = 9), LRRK2+/PD− (n = 19), and LRRK2+/PD+ individuals (n = 9). Kruskal–Wallis test and Dunn's post-hoc test: controls vs. LRRK2+/PD−, p = 0.12; controls vs. LRRK2+/PD+, p = 0.49; LRRK2+/PD− vs. LRRK2+/PD+, p > 0.99. Experiments were performed using three independent replicates. **p < 0.01; *p < 0.05.

