Figure 3.
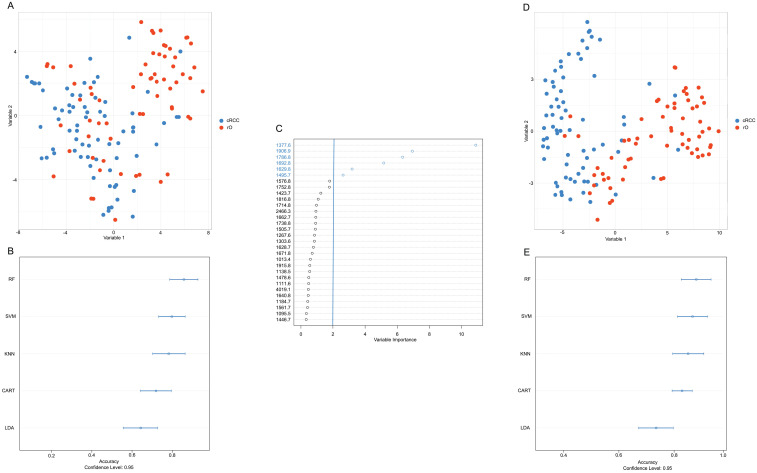
Development of an accurate classification algorithm. To reduce the high-dimensional dataset obtained from peptide MSI (intensities of 159 m/z peaks per sample) and to visualize the results a t-distributed stochastic neighbor embedding (t-SNE) analysis was performed (A, D). Common machine classification algorithms were chosen in order to perform classification between cRCC and rO samples based on m/z intensities obtained from MSI (B, E). A cross validation method was chosen to determine the classification accuracy.m/z peaks were ranked by their importance to contribute to a correct classification of cRCC and rO (C). Overall, the figure shows that reduction of variables (i.e. m/z peaks) to six most important improved the classification accuracy. This is reflected in a clearer distinction of cRCC and rO by t-SNE (D) and higher classification accuracy by different machine classification algorithms (E) after variable reduction. Abbreviations: CART, classification and regression tree; KNN, k-nearest neighbors; LDA, linear discriminant analysis; RF, random forest; SVM, support vector machine.

