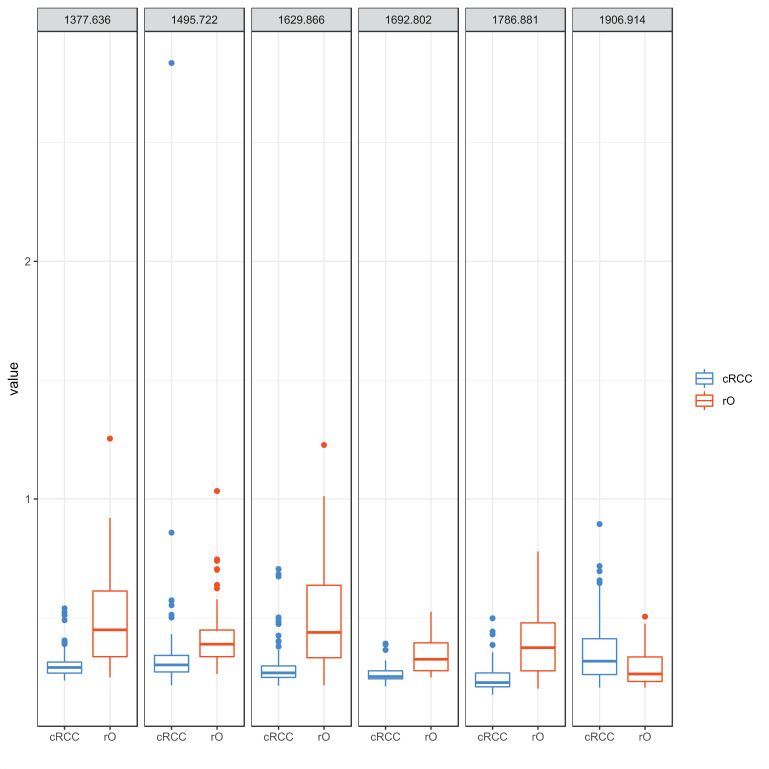
Figure 4.
Peptide intensity profile of selected m/z peaks in cRCC and rO. The figure visualizes the intensity of selected m/z peaks in the 71 cRCC and 64 rO as boxplots. The six m/z peaks obtained from proteomic analysis that contributed most to the differentiation between cRCC and rO are shown. Each of the outlier dots refers to one patient sample.

