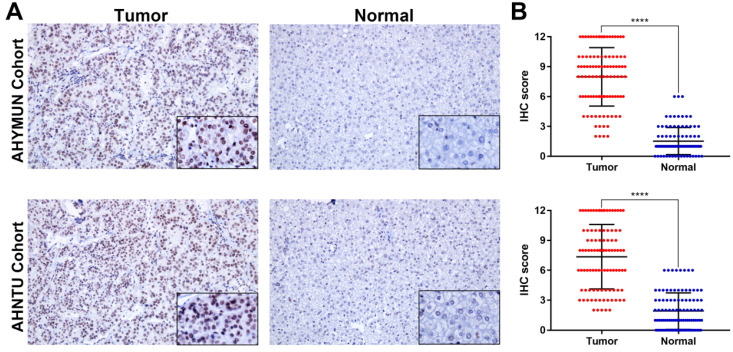
Figure 3.
IHC staining and scatter plot analysis of hepatocellular carcinoma and normal tissues of patients in the AHYMUN and AHNTU cohorts. A. IHC staining of hepatocellular carcinoma and normal tissues from patients in the AHYMUN and AHNTU cohorts; B. Scatter plot showing the IHC scores derived from normal and tumour tissues (p < 0.001) from different cohorts.

