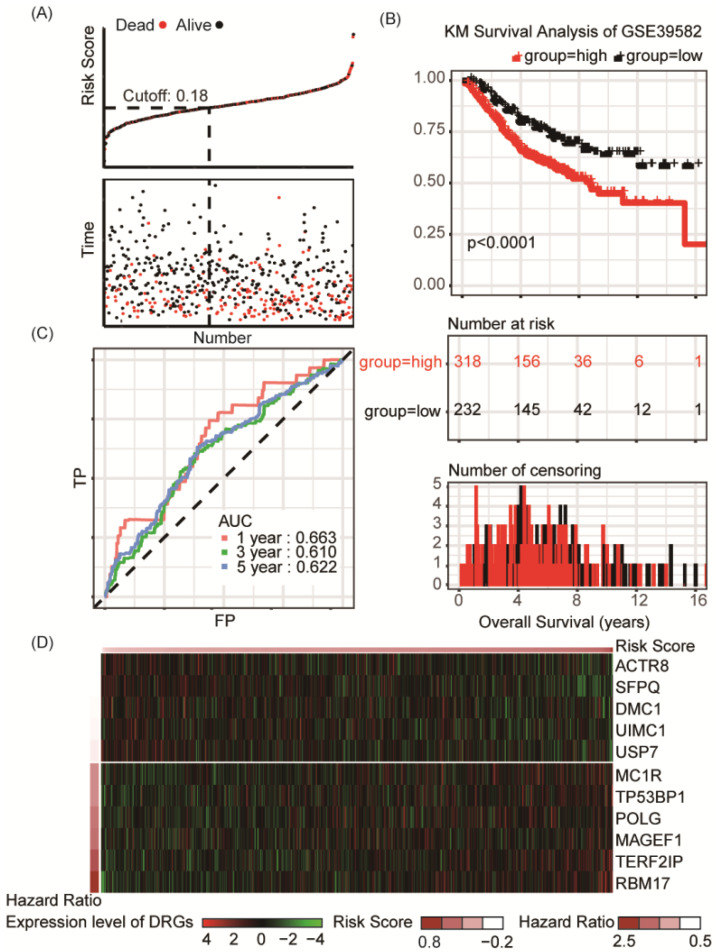
Figure 5.
Risk group identified by the DRG classifier, KM survival analysis and ROC curve of GSE39582 dataset. (A) The relationship between alive/dead status with Risk Score and survival time (years). The cutoff of Risk Score is set at 0.18. (B) KM survival analysis of overall survival for high-risk or low-risk group patients. (C) ROC analysis of the eleven-DRG prognostic signature. The AUC for 1-year, 3-year, 5-year predicting were 0.663, 0.610 and 0.622, respectively. (D) Heatmap displayed the expression level of eleven DRGs.

