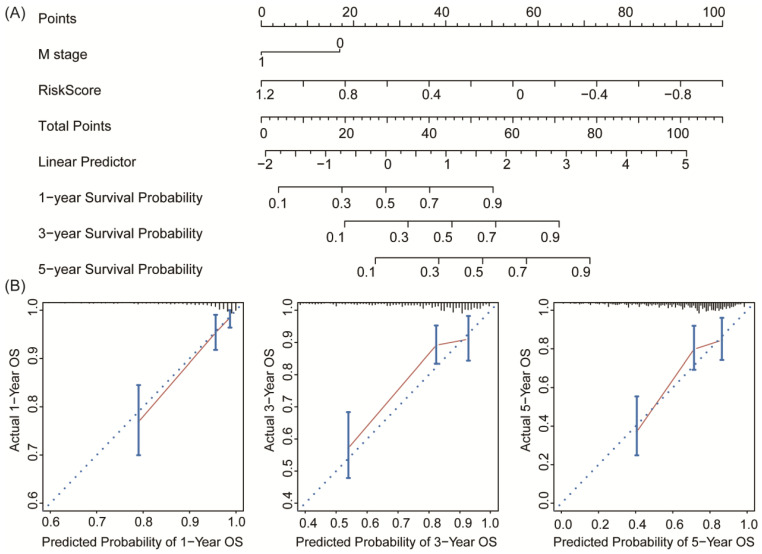
Figure 7.
Nomogram and calibration analysis for the DRG prognostic signature. (A) Nomogram plotted by the independent factors of patients' survival. The probability of long-term survival can be calculated by adding the corresponding points of M stage and Risk Score in the nomogram. (B) Calibration plots displayed the relationship between actual and the nomogram-predicted survival, which indicated a powerful predicting capability of the nomogram.

