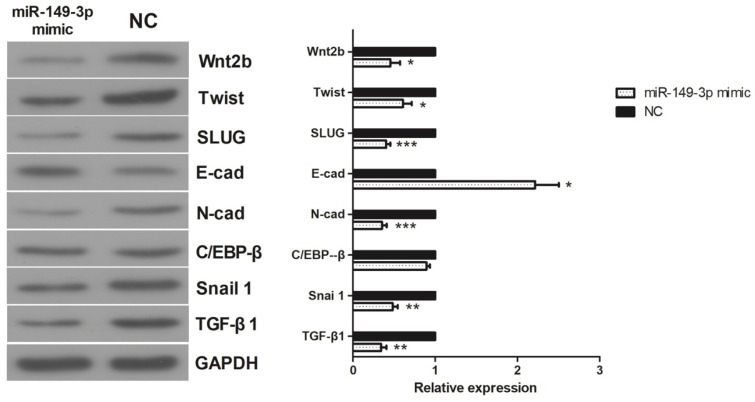
Figure 5.
Western Blot results of TGF-β1, C/EBP β, Snail 1, Wnt 2b, Slug, Twist, E-cadherin and N-cadherin. In miR-149-3p mimics treated group, the expression of E-cadherin was significantly increased; the expression of N-cadherin, Snail, Slug, TGF-β1, Wnt2b and Twist were significantly decreased; the expression of C/EBPβ had no significant difference. *: p<0.05, **: p<0.01, ***: p<0.001.

