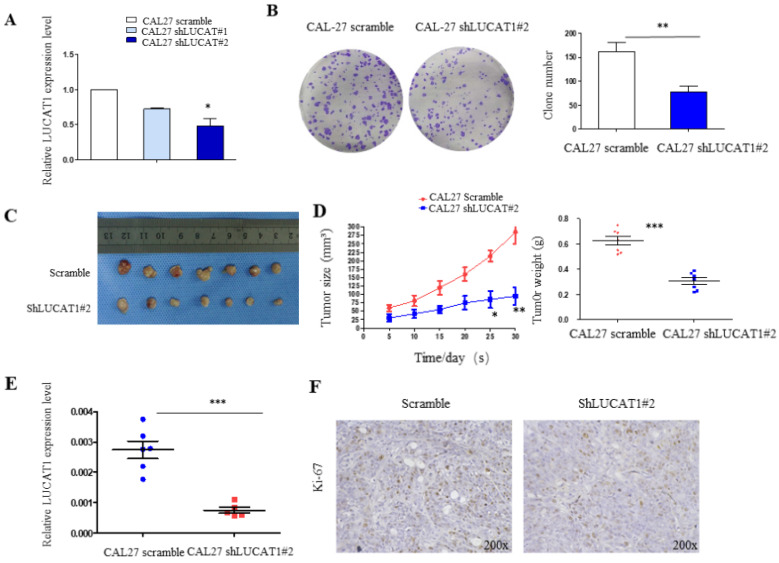
Figure 4.
The impact of LUCAT1 on tumourigenesis in vivo. A. RT-PCR detection of the expression levels of LUCAT1 in CAL27 shLUCAT1 cells. B. Colony formation result in CAL27 shLUCAT1 cells. C and D. Scramble and shLUCAT1 were injected into nude mice (n = 7). The tumour volumes were calculated every 5 days after injection. The bars indicate SD. E. The tumour weights are shown as the means of tumour weights ± S.D. F. Histopathology of xenograft tumours. The tumour sections were subjected IHC staining using an antibody against Ki-67. Error bars indicate the means ± S.E.M. *P < 0.05, **P < 0.01. ***P < 0.001.

