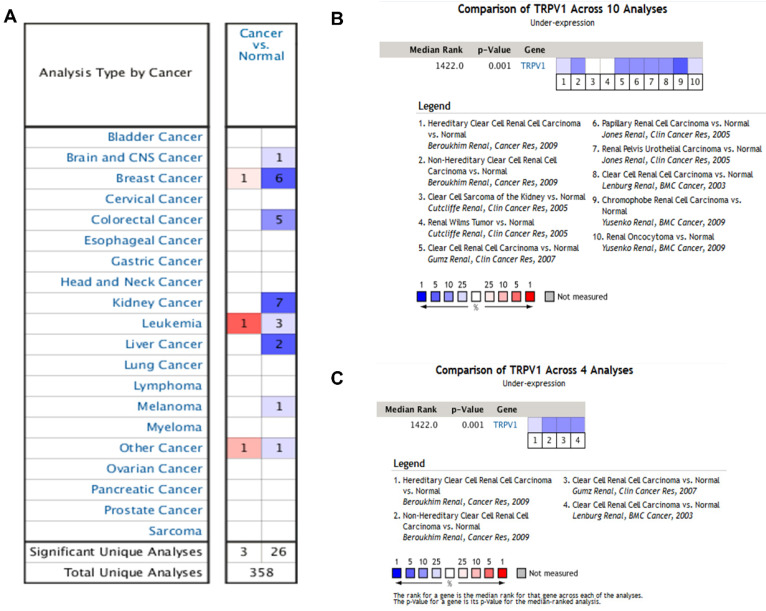
Figure 1.
TRPV1 expression analysis in Oncomine database. TRPV1 expression level of different cancer types compared with normal tissues (A); Summary analysis of TRPV1 expression in 10 renal cell carcinoma datasets (B), and 4 clear cell renal cell carcinoma datasets (C). The color blue represents low expression, and red represents high expression.

