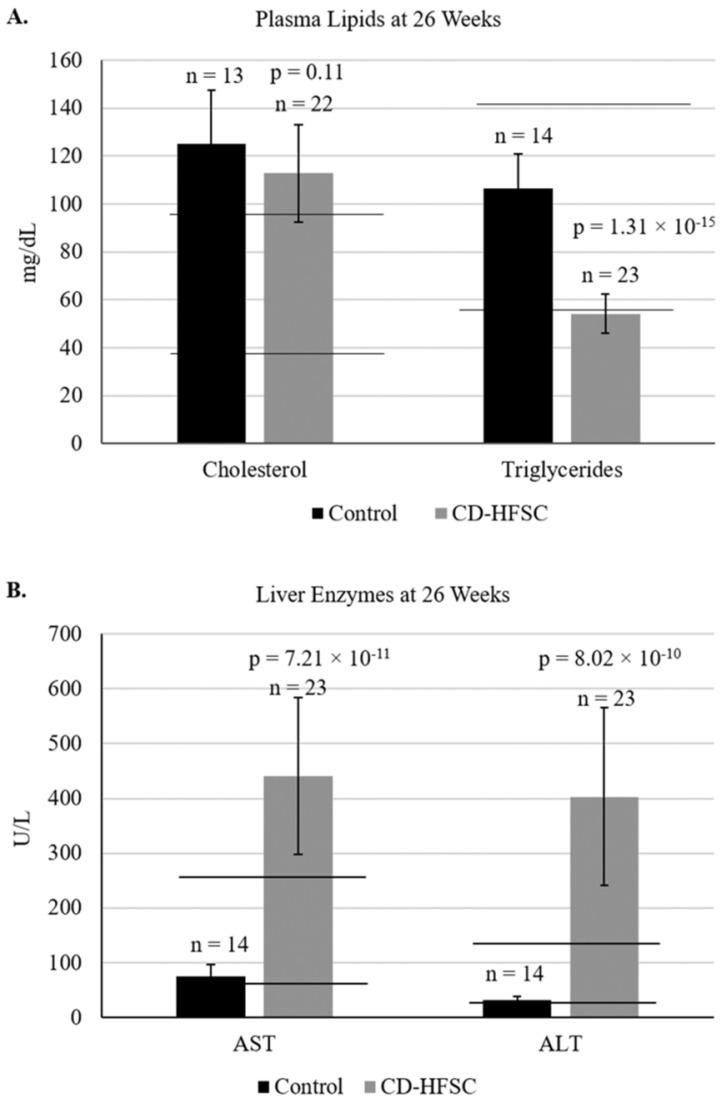
Figure 3.
A. Plasma lipid and B. plasma enzyme profile in mice fed the control diet (black) and the CD-HFSC diet (grey). Mice fed the CD-HFSC diet show lower plasma triglyceride levels and higher levels of plasma aspartate aminotransferase (AST) and alanine aminotransferase (ALT) compared to mice fed the control diet, likely reflecting lipid retention in the liver and liver damage, respectively. Horizontal black lines indicate lower and upper limits of normal plasma lipid and enzyme levels.

