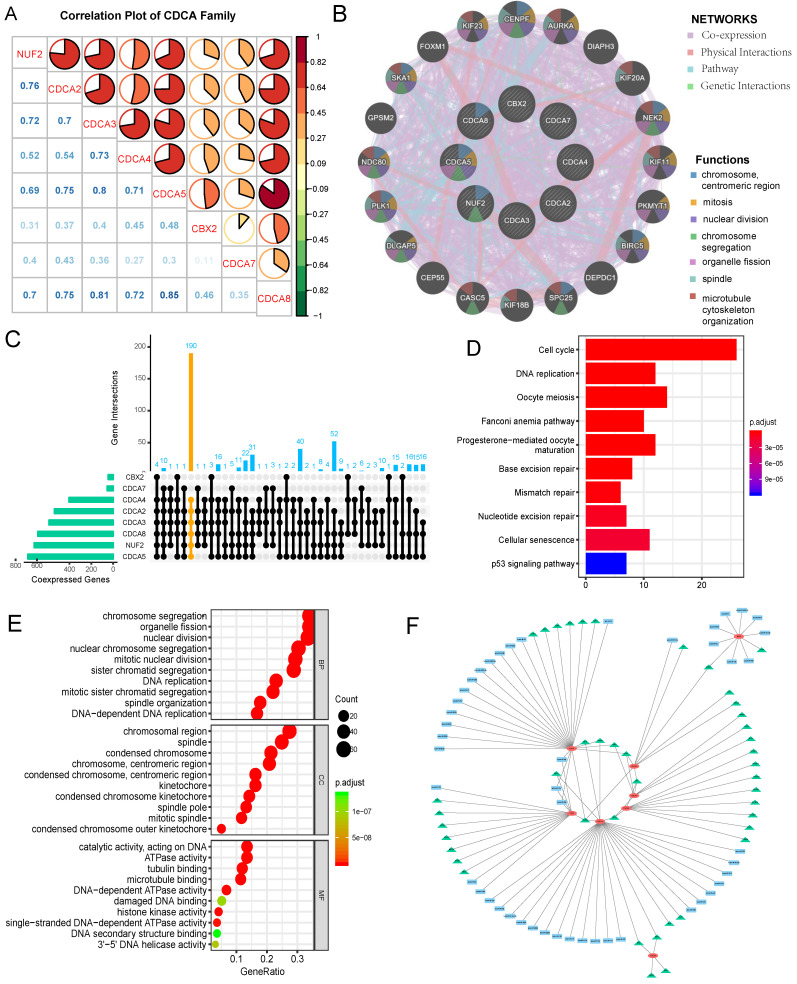
Figure 9.
Correlations among CDCA family members, protein-protein interaction(PPI) network construction, assessment of up-stream targets and down-stream signaling pathways of CDCAs in EC (A) Correlation plot among CDCA family members. The color of the pie chart represents the correlation of the expression of two genes(red: positively correlated, green: negatively correlated). The area of the colored pie is proportional to the strength of mutual correlation. The blue numbers in the lower part represent the specific correlation coefficient(by Spearman test). (B)PPI network and functional analysis from GENEMANIA (C)UpSetR plot illustrating the numbers of co-expressed genes shared by different sets of CDCA family members, with yellow highlighting the co-expressed genes with NUF2,CDCA2/3/4/5/8 (D) Enriched KEGG pathways of the shared co-expressed genes with NUF2, CDCA2/3/4/5/8 (E)Top 10 enriched GO terms of co-expressed genes with NUF2, CDCA2/3/4/5/8. BP: biological process; MF: molecular function; CC: cellular component. (F) The regulatory network of miRNA and transcription factor targets of CDCAs. The green triangle represents possible transcription targets. The blue rectangle represents possible miRNA targets.

