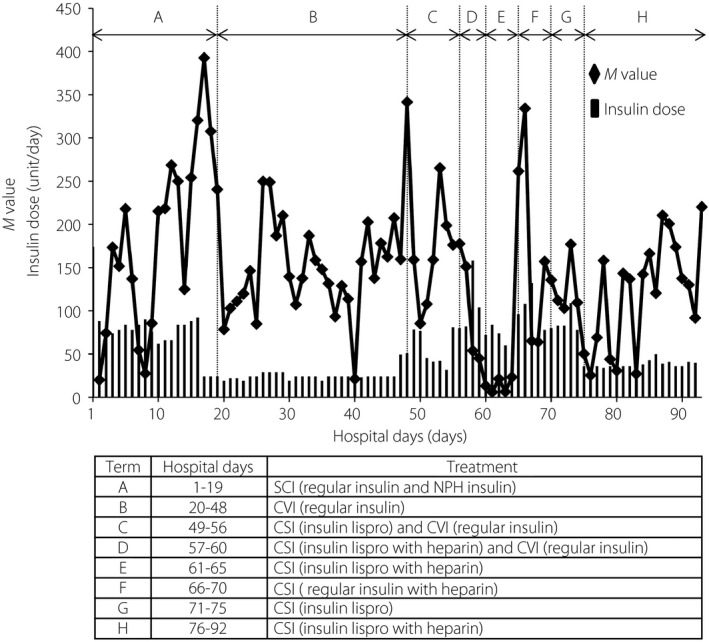
Figure 2.

Blood glucose profile and administered insulin doses in different insulin regimens. Blood glucose levels were measured six times in a day (00.00, 06.00, 08.00, 12.00, 18.00, 21.00 hours) and calculated M values by the blood glucose profile using the formula described below. The M values and administrated insulin doses are presented as black diamonds with a solid line and black bars, respectively. . CSI, continuous subcutaneous infusion; CVI, continuous venous infusion; NPH, neutral protamine Hagedorn; SCI, subcutaneous insulin injection.
