
Figure 4. Immune correlates of COVID-19 outcomes.
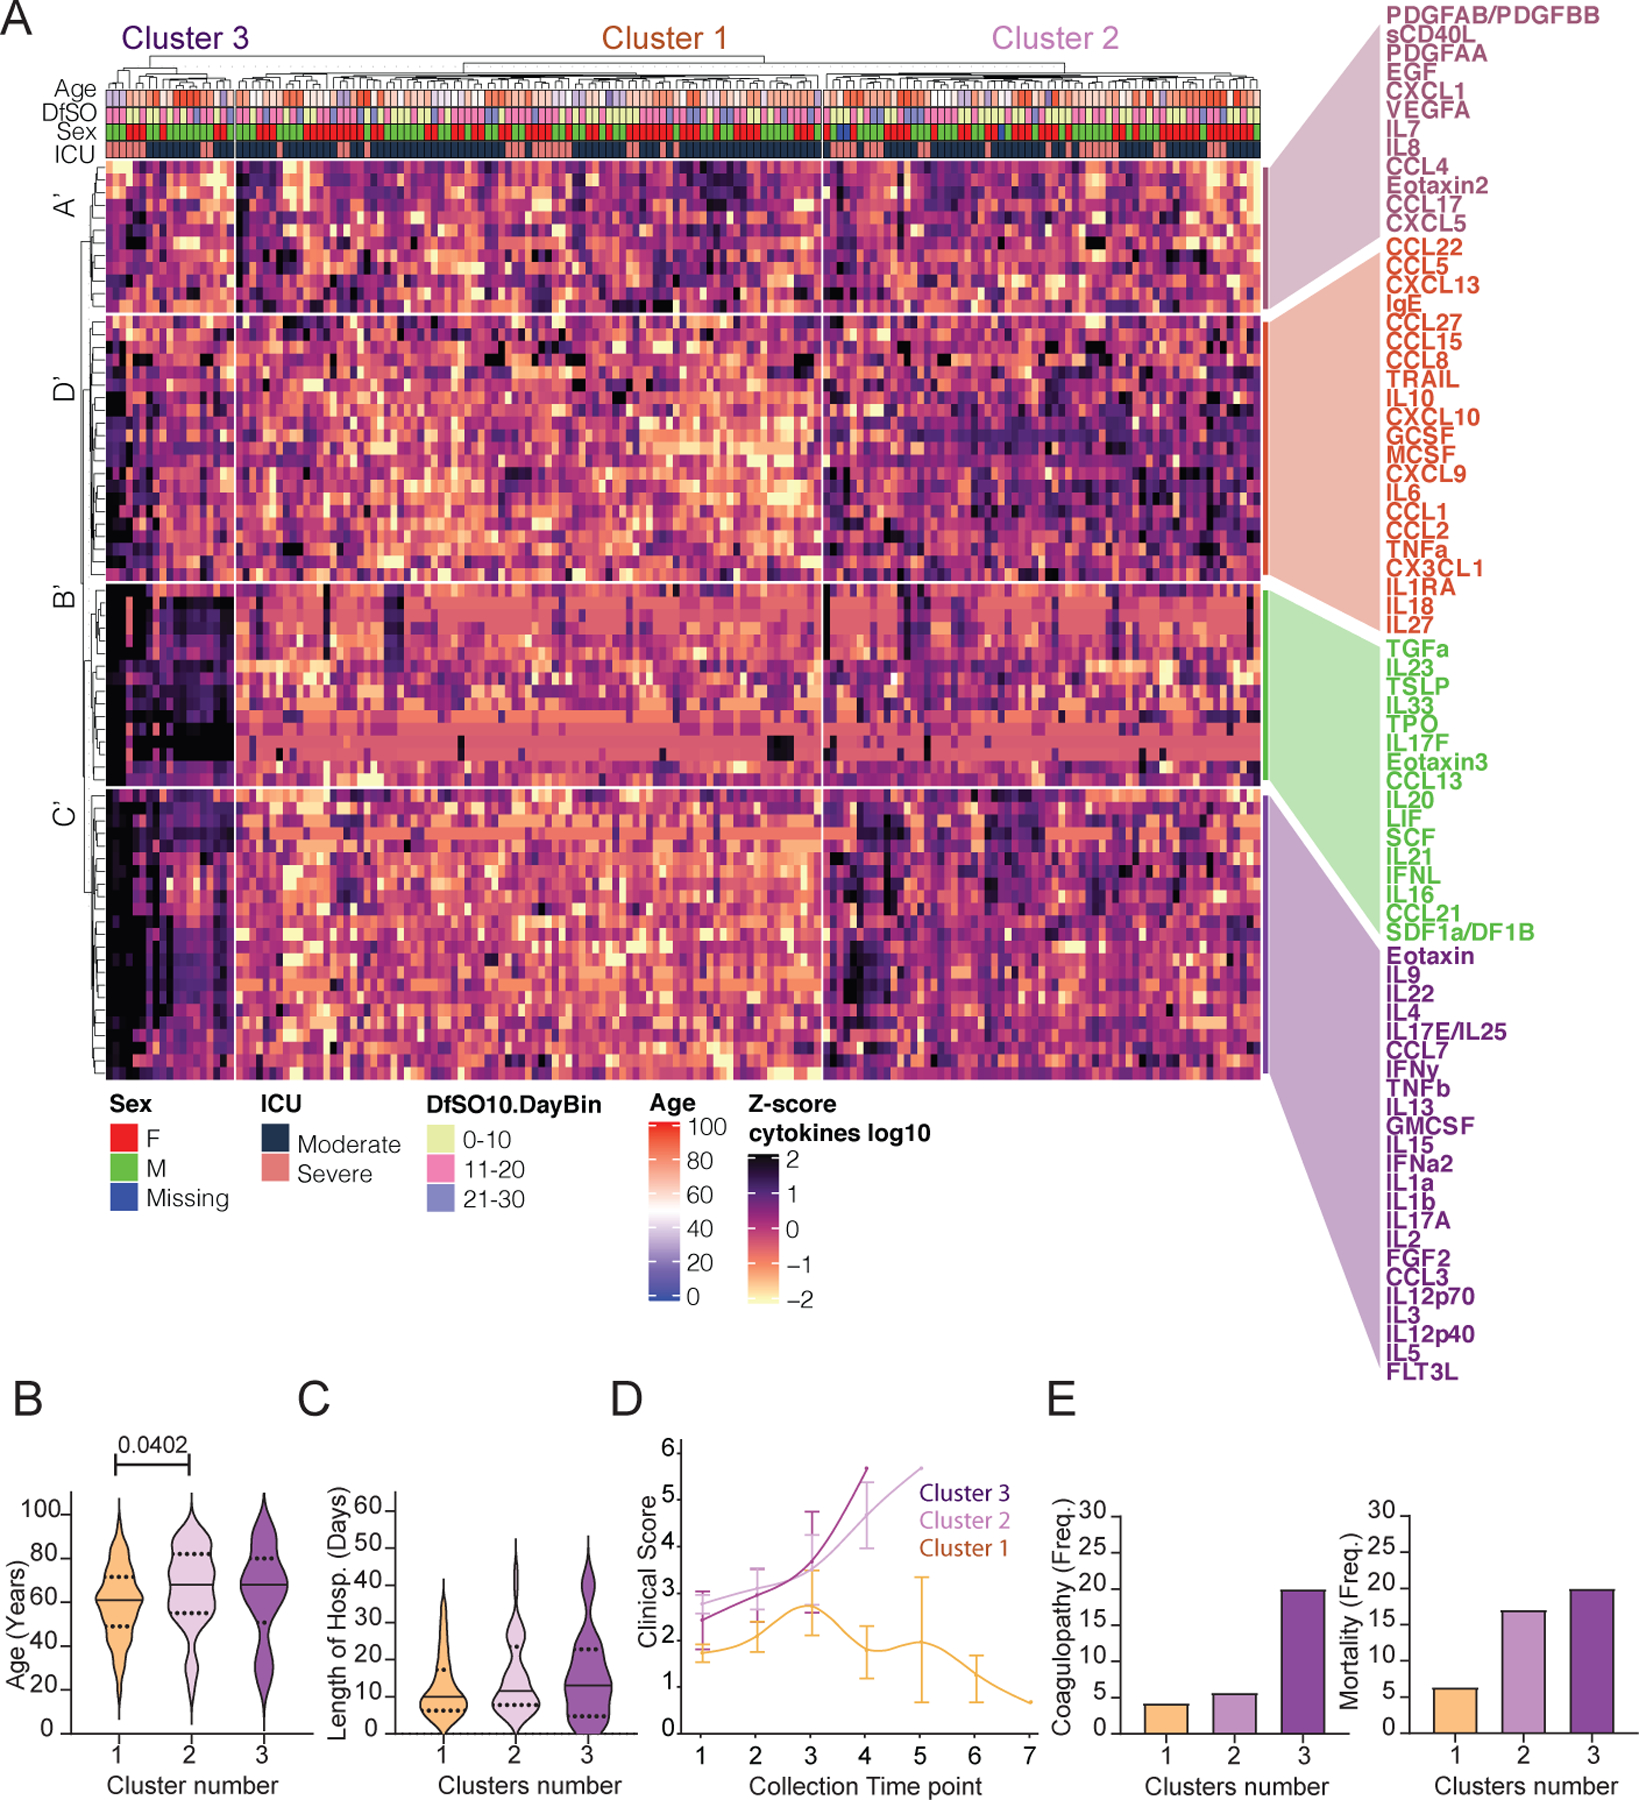
a, Unbiased heat map comparisons of cytokines within peripheral blood mononuclear cells (PBMCs) measured at distinct time points in COVID-19 patients. Measurements were normalized across all patients. K-means clustering was used to determine Clusters 1–3 (Cluster 1, n=84; Cluster 2, n=66; Cluster 3, n=20). b, c, Distribution of age (b) and length of hospital stay (violin plots) (c) of patients within each cluster. For statistical differences, adjusted P values calculated using one-way ANOVA with Tukey’s correction for multiple comparisons are shown (age: F(2, 90) = 3.115; P = 0.0492). Solid lines, median; dotted lines, quartiles. d, Disease progression measured by clinical severity score for patients in each cluster. Data (mean ± s.e.m.) are ordered by the collection time points for each patient, with regular collection intervals of 3–4 days (Extended Data Fig. 7). e, Percentage of patients in each cluster with new-onset coagulopathy or death.