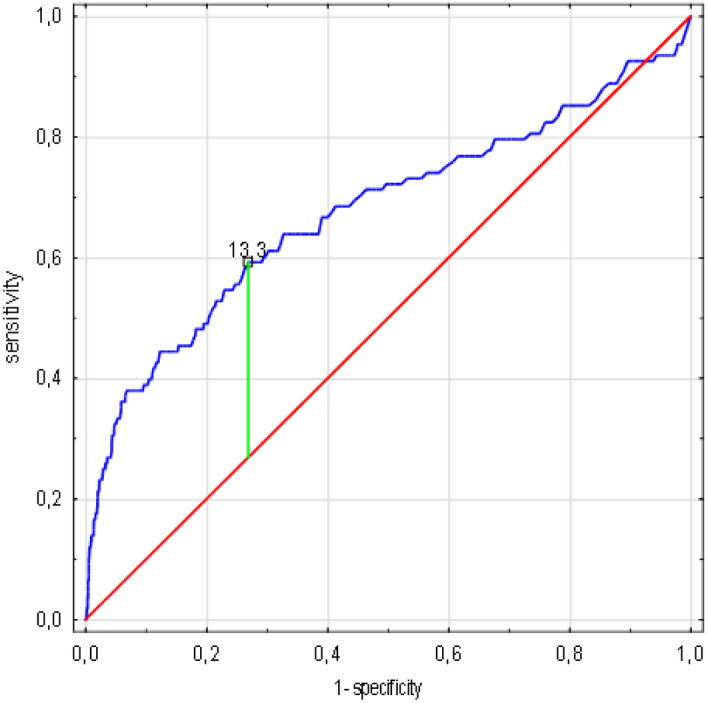
Figure 5.

Leucocyte count cut-off value associated with increasing risk of death in ROC analysis. (n = 1638 patients / 108 died). Legend: sensitivity (True Positive Rate), 1-specificity (False Positive Rate); scale is in decimals of sensitivity and specificity; interval every 0.2, i.e. 20%; green line—optimum cut-off point (max. Youden’s index = 0,32, cut-off point: 13,3), blue line—ROC curve with AUC 0.677, 95%CI 0.62 -0.739, SE 0.032, p < 0.001, red line—classification due to chance with AUC 0.5. Abbreviations: ROC-receiver operating characteristic, AUC-area under the curve, SE-standard error. Method: AUC, ROC and SE analyzes performed according to Hanley and McNeil10.
