Figure 1.
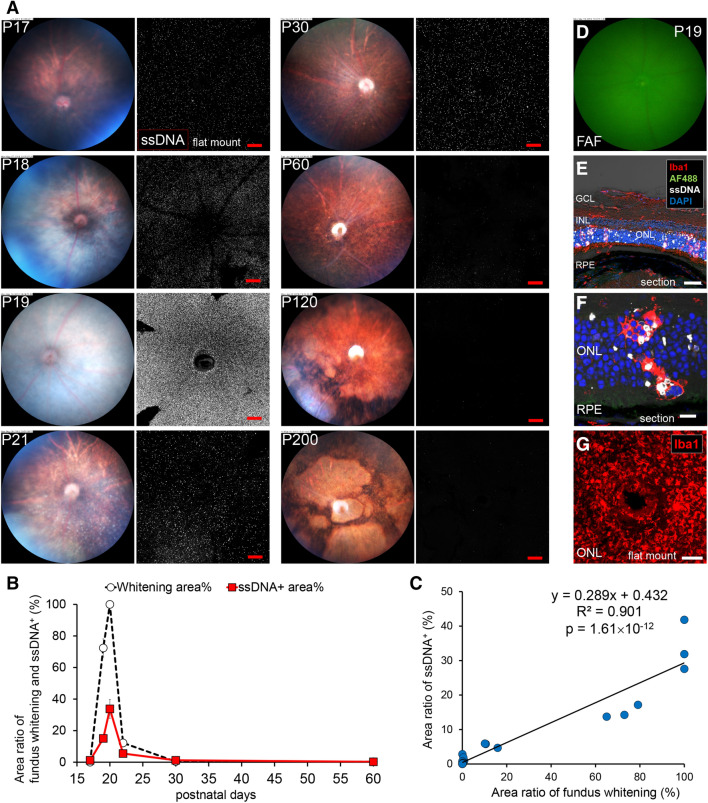
Relationship between fundus whitening and apoptosis of photoreceptors in the retina of rd10 mice. (A) Pictures show the time course change of the fundus color and apoptosis in the retina of rd10 from P17 to P200. Left pictures are in vivo fundus color photography. Right pictures show the confocal images of extracted flat-mounted retina at the ONL level, labeled with an apoptosis marker ssDNA (white). Scale bars, 100 μm. Fundus started to whiten on P19. Whitening spread throughout the whole surface on P20. On P22, white granular spots on the subretina were observed. Around P30–P60, the color tone of the retina became normal. Remarkable retinal atrophy was observed after P120. (B) Graphs show time course of fundus whitening area (%) (White marker) and ssDNA+ area (%) (Red marker). The markers of the graph show mean and standard deviation (SD) (n = 3). Peaks of both parameters coincide. (C) Scatter plot shows the relationship between the ssDNA+ area (%) and the whitening area (%). Measurement points were P17, 18, 19, 21, 30, 60, 120 and 200, n = 3 respectively. A linear relationship was found between both factors (R2 = 0.901). (D) There were no autofluorescent spots in FAF imaging of the central retina. (E, F, G) Pictures show the histopathological findings on fundus whitening at P19. (E) Flat-mounted retina labeled with Iba1, ssDNA and DAPI. SsDNA+ apoptotic photoreceptors in the ONL and infiltration of Iba1+ microglia from the ONL to the OS were observed. Scale bar, 40 μm. AF488, autofluorescence excited by 488 nm light; GCL, ganglion cell layer; INL, inner nuclear layer; RPE, retinal pigment epithelium. (F) Magnified image of the retinal section at the ONL. Microglia infiltrated from the ONL to the OS and phagocytized both apoptotic and non-apoptotic photoreceptors. Scale bar, 10 μm. (G) Retinal flat mount of rd10 (P22) at the depth of the OS, labeled with Iba1. Iba1+ microglia accumulated in the OS at a high density. Scale bar, 100 μm.

