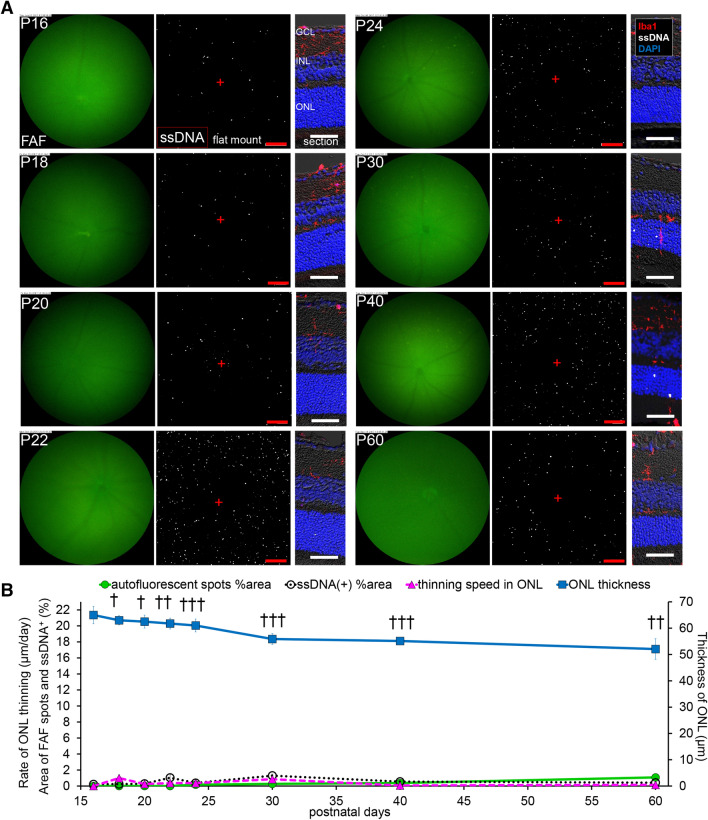
Figure 4.
Relationship in fundus autofluorescent spots, apoptosis of photoreceptors and retinal ONL thickness in the central retina of rd10 raised in dark. (A) Pictures show the time course change from P16 to P60, in the central retina of rd10 mice raised in dark. Left pictures are in vivo FAF imaging with a retinal imaging microscope. Middle pictures show the confocal images of extracted flat-mounted retina at the ONL level, labeled with ssDNA (white). Scale bars, 100 μm, “ + ” show the center of the optic nerve head. Right pictures show the retinal section labeled with DAPI (blue), ssDNA (white) and Iba1 (red). Scale bars, 50 μm. (B) The graphs show the quantification of the FAF spot area % (green line), the ssDNA+ area % (black line), the thickness of the ONL (blue line) and the thinning rate of the ONL (magenta line). The markers of the graph show mean and SD (n = 4). (†p < 0.005, ††p < 0.00005, †††p < 0.00000005, t test in comparison to the central retina raised under regular light cycle). Thinning of ONL was significantly suppressed compared to the group raised under regular light cycle. The appearance of FAF spots and ssDNA+ apoptotic cells were also suppressed in dark-raised group.

