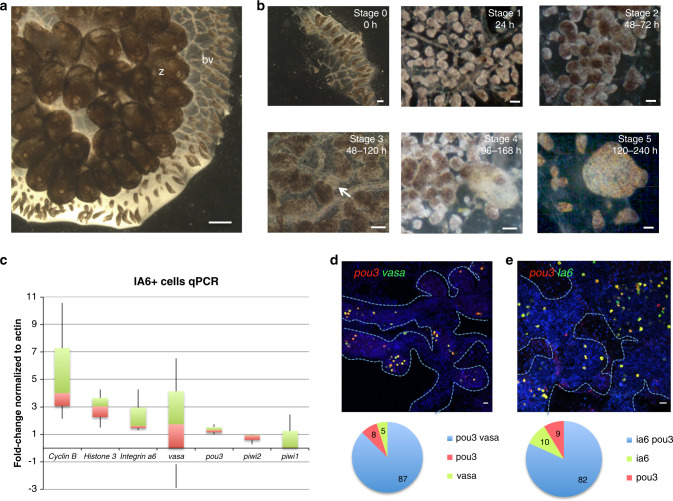
Fig. 1. Stages of whole body regeneration, gene expression in IA6+ cells.
a Botrylloides diegensis, whole colony brightfield image, dorsal. Zooids (z) are embedded in a common, transparent tunic. Blood vessels (bv) extend throughout the tunic and are shared by the zooids of the colony. At the periphery of the colony, blood vessels form terminal sacs termed ampullae. Images are representatives of 20 independent experiments. Scale bar 1 mm. b Stages of whole body regeneration, brightfield images. Blood vessels are surgically separated from the colony (stage 0). During the first 24 h, the blood vessel begins to remodel (stage 1). After 48 h, blood vessels become condensed and highly pigmented (stage 2). Regeneration begins when a double vesicle is formed, consisting of two layers of epithelium (stage 3, white arrow). This double vesicle undergoes organogenesis (stage 4) and gives rise to a new, filter feeding body (stage 5). Images are representatives of 20 independent experiments. Scale bars 200 μm. c qPCR analysis showing expression of cyclin B, integrin-alpha-6, vasa, pou3, piwi2, and piwi1 in IA6+ cells isolated by flow cytometry. Data are expressed as averages of fold changes normalized to actin, n = 4. Box plot shows interquartile range (the distance between the upper and lower quartiles) and whiskers indicate the minimum and maximum of the data. d FISH showing co-expression of pou3 (red) and vasa (green) in stage 0. DNA was stained with Hoechst (blue). Blue dashed lines outline blood vessel boundaries. Scale bar 20 μm. Single-positive and double-positive cells were counted using the cell counter feature in FIJI, and for each stage, four images from four independent samples were counted. Pie graph shows averages of percentages of pou3/vasa-double-positive cells as well as pou3 and vasa single-positive cells. e FISH showing co-expression of pou3 (red) and ia6 (green) in stage 0. DNA was stained with Hoechst (blue). Blue dashed lines outline blood vessel boundaries. Scale bar 20 μm. Single-positive and double-positive cells were counted using the cell counter feature in FIJI, and for each stage, four images from four independent samples were counted. Pie graph shows averages of percentages of pou3/ia6-double-positive cells as well as pou3 and ia6 single-positive cells. Source data are provided as a Source Data file.

