
Fig. 2.
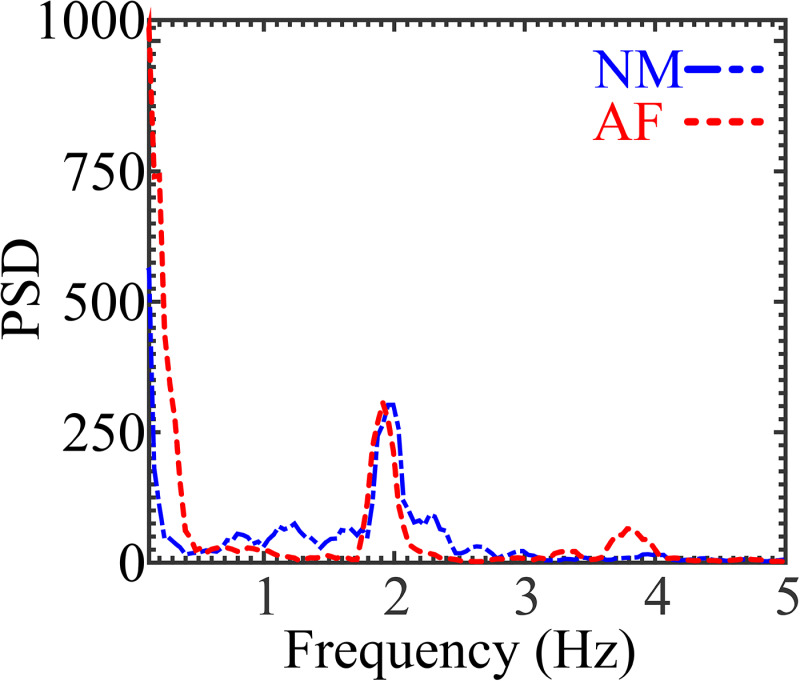
PSD analysis from mice shows the most energetic tissue movements around 2 and 1.9 Hz for the normal and affected mice, respectively
Official websites use .gov
A
.gov website belongs to an official
government organization in the United States.
Secure .gov websites use HTTPS
A lock (
) or https:// means you've safely
connected to the .gov website. Share sensitive
information only on official, secure websites.
PSD analysis from mice shows the most energetic tissue movements around 2 and 1.9 Hz for the normal and affected mice, respectively