
Fig. 1.
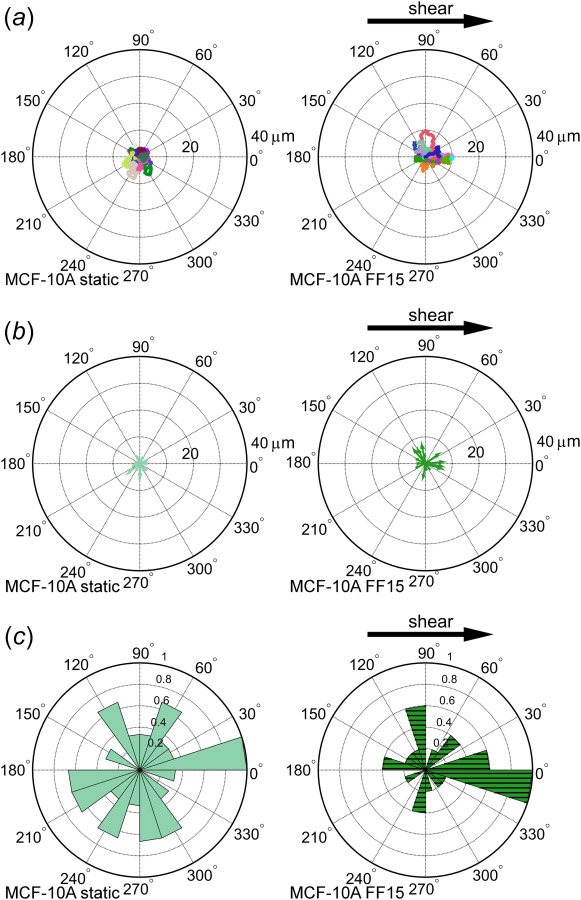
Tracking of benign MCF-10A epithelial cells reveals random cell migration with less strong shear stress response. (a) Individual cells were tracked and plotted with track initiation shifted to the plot origin. Each tracing line represents a distinct cell migration path. A slight bias of cell migrating along the flow direction is seen in (b) the vector plot and (c) the angle histogram.