. 2020 Jul 6;142(8):081012. doi: 10.1115/1.4046974

Fig. 13.

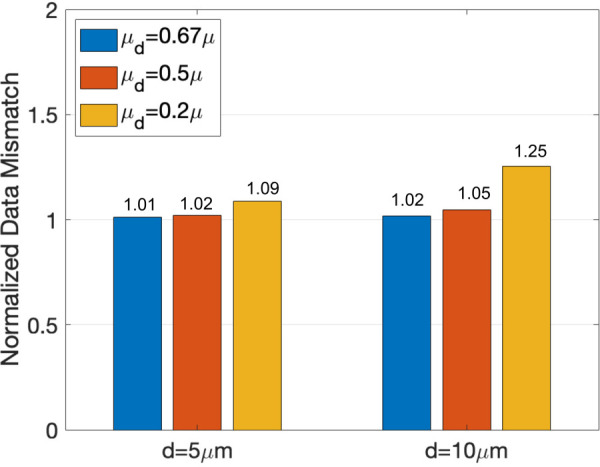
Sensitivity analysis of the displacement mismatch (see Eq. (7)) to hydrogel degradation. Representative results are shown for the 3T3 cell in Fig. 3(d). In particular, we allow for possible hydrogel degradation by setting the shear modulus (μd) of the hydrogel matrix within either d=5μm or 10μm of the cell surface to 0.67×, 0.5×, or 0.2× that of the surrounding pristine matrix. We then solve the inverse problem for each of the above cases, and plot the associated displacement data mismatch (see Eq. (7)) normalized by that for a pristine matrix with no degradation. We find that all hydrogels with degradation lead to larger displacement data mismatch, indicating thereby that the measured displacement data are most consistent with the modulus of the pristine hydrogel.

Sensitivity analysis of the displacement mismatch (see Eq. (7)) to hydrogel degradation. Representative results are shown for the 3T3 cell in Fig. 3(d). In particular, we allow for possible hydrogel degradation by setting the shear modulus (μd) of the hydrogel matrix within either d=5μm or 10μm of the cell surface to 0.67×, 0.5×, or 0.2× that of the surrounding pristine matrix. We then solve the inverse problem for each of the above cases, and plot the associated displacement data mismatch (see Eq. (7)) normalized by that for a pristine matrix with no degradation. We find that all hydrogels with degradation lead to larger displacement data mismatch, indicating thereby that the measured displacement data are most consistent with the modulus of the pristine hydrogel.