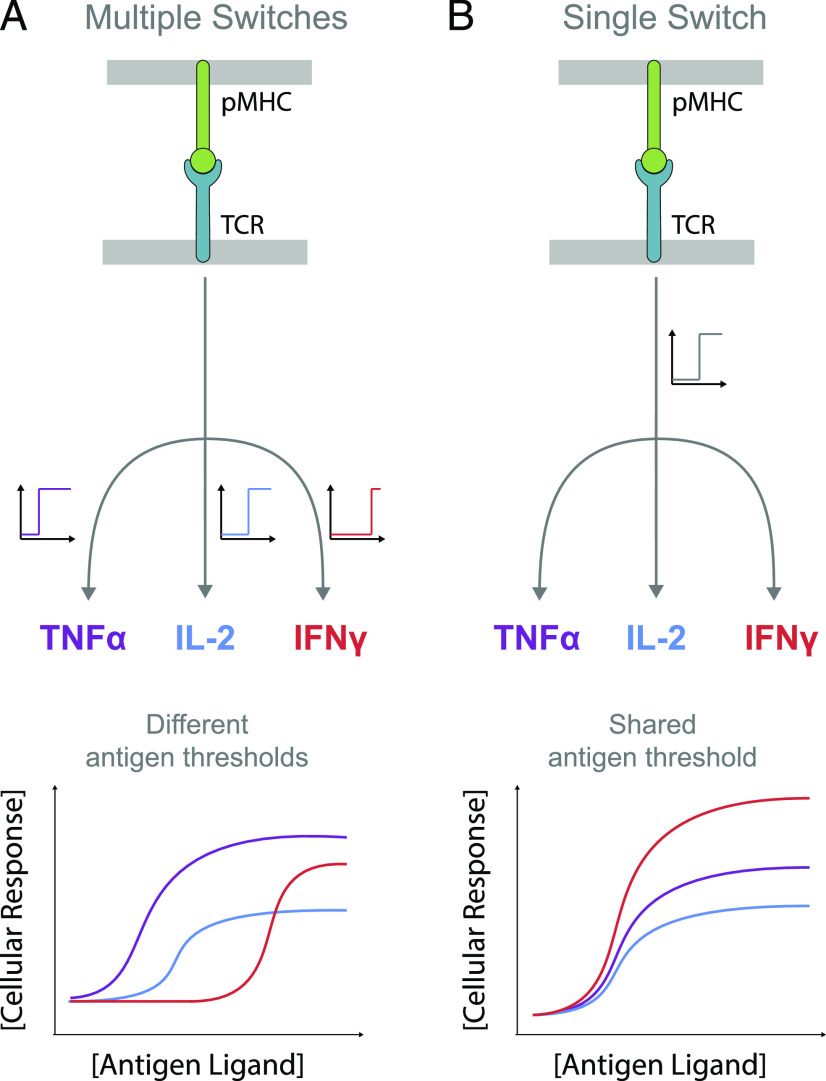
FIGURE 1.
Phenotypic models for pMHC Ag-induced digital TCR signaling leading to multiple T cell effector responses. (A) Schematic of TCR signaling showing different rate-limiting digital switches (on/off) controlling different cytokines. The Ag threshold for producing each cytokine can vary if the digital switch has a different threshold with respect to TCR signaling. (B) Schematic of TCR signaling showing a common rate-limiting digital switch controlling different cytokines. The Ag threshold is identical because all cytokines are produced when the switch is on. In both models, the amount of cytokine produced can be regulated differently for each cytokine downstream of the switch.

