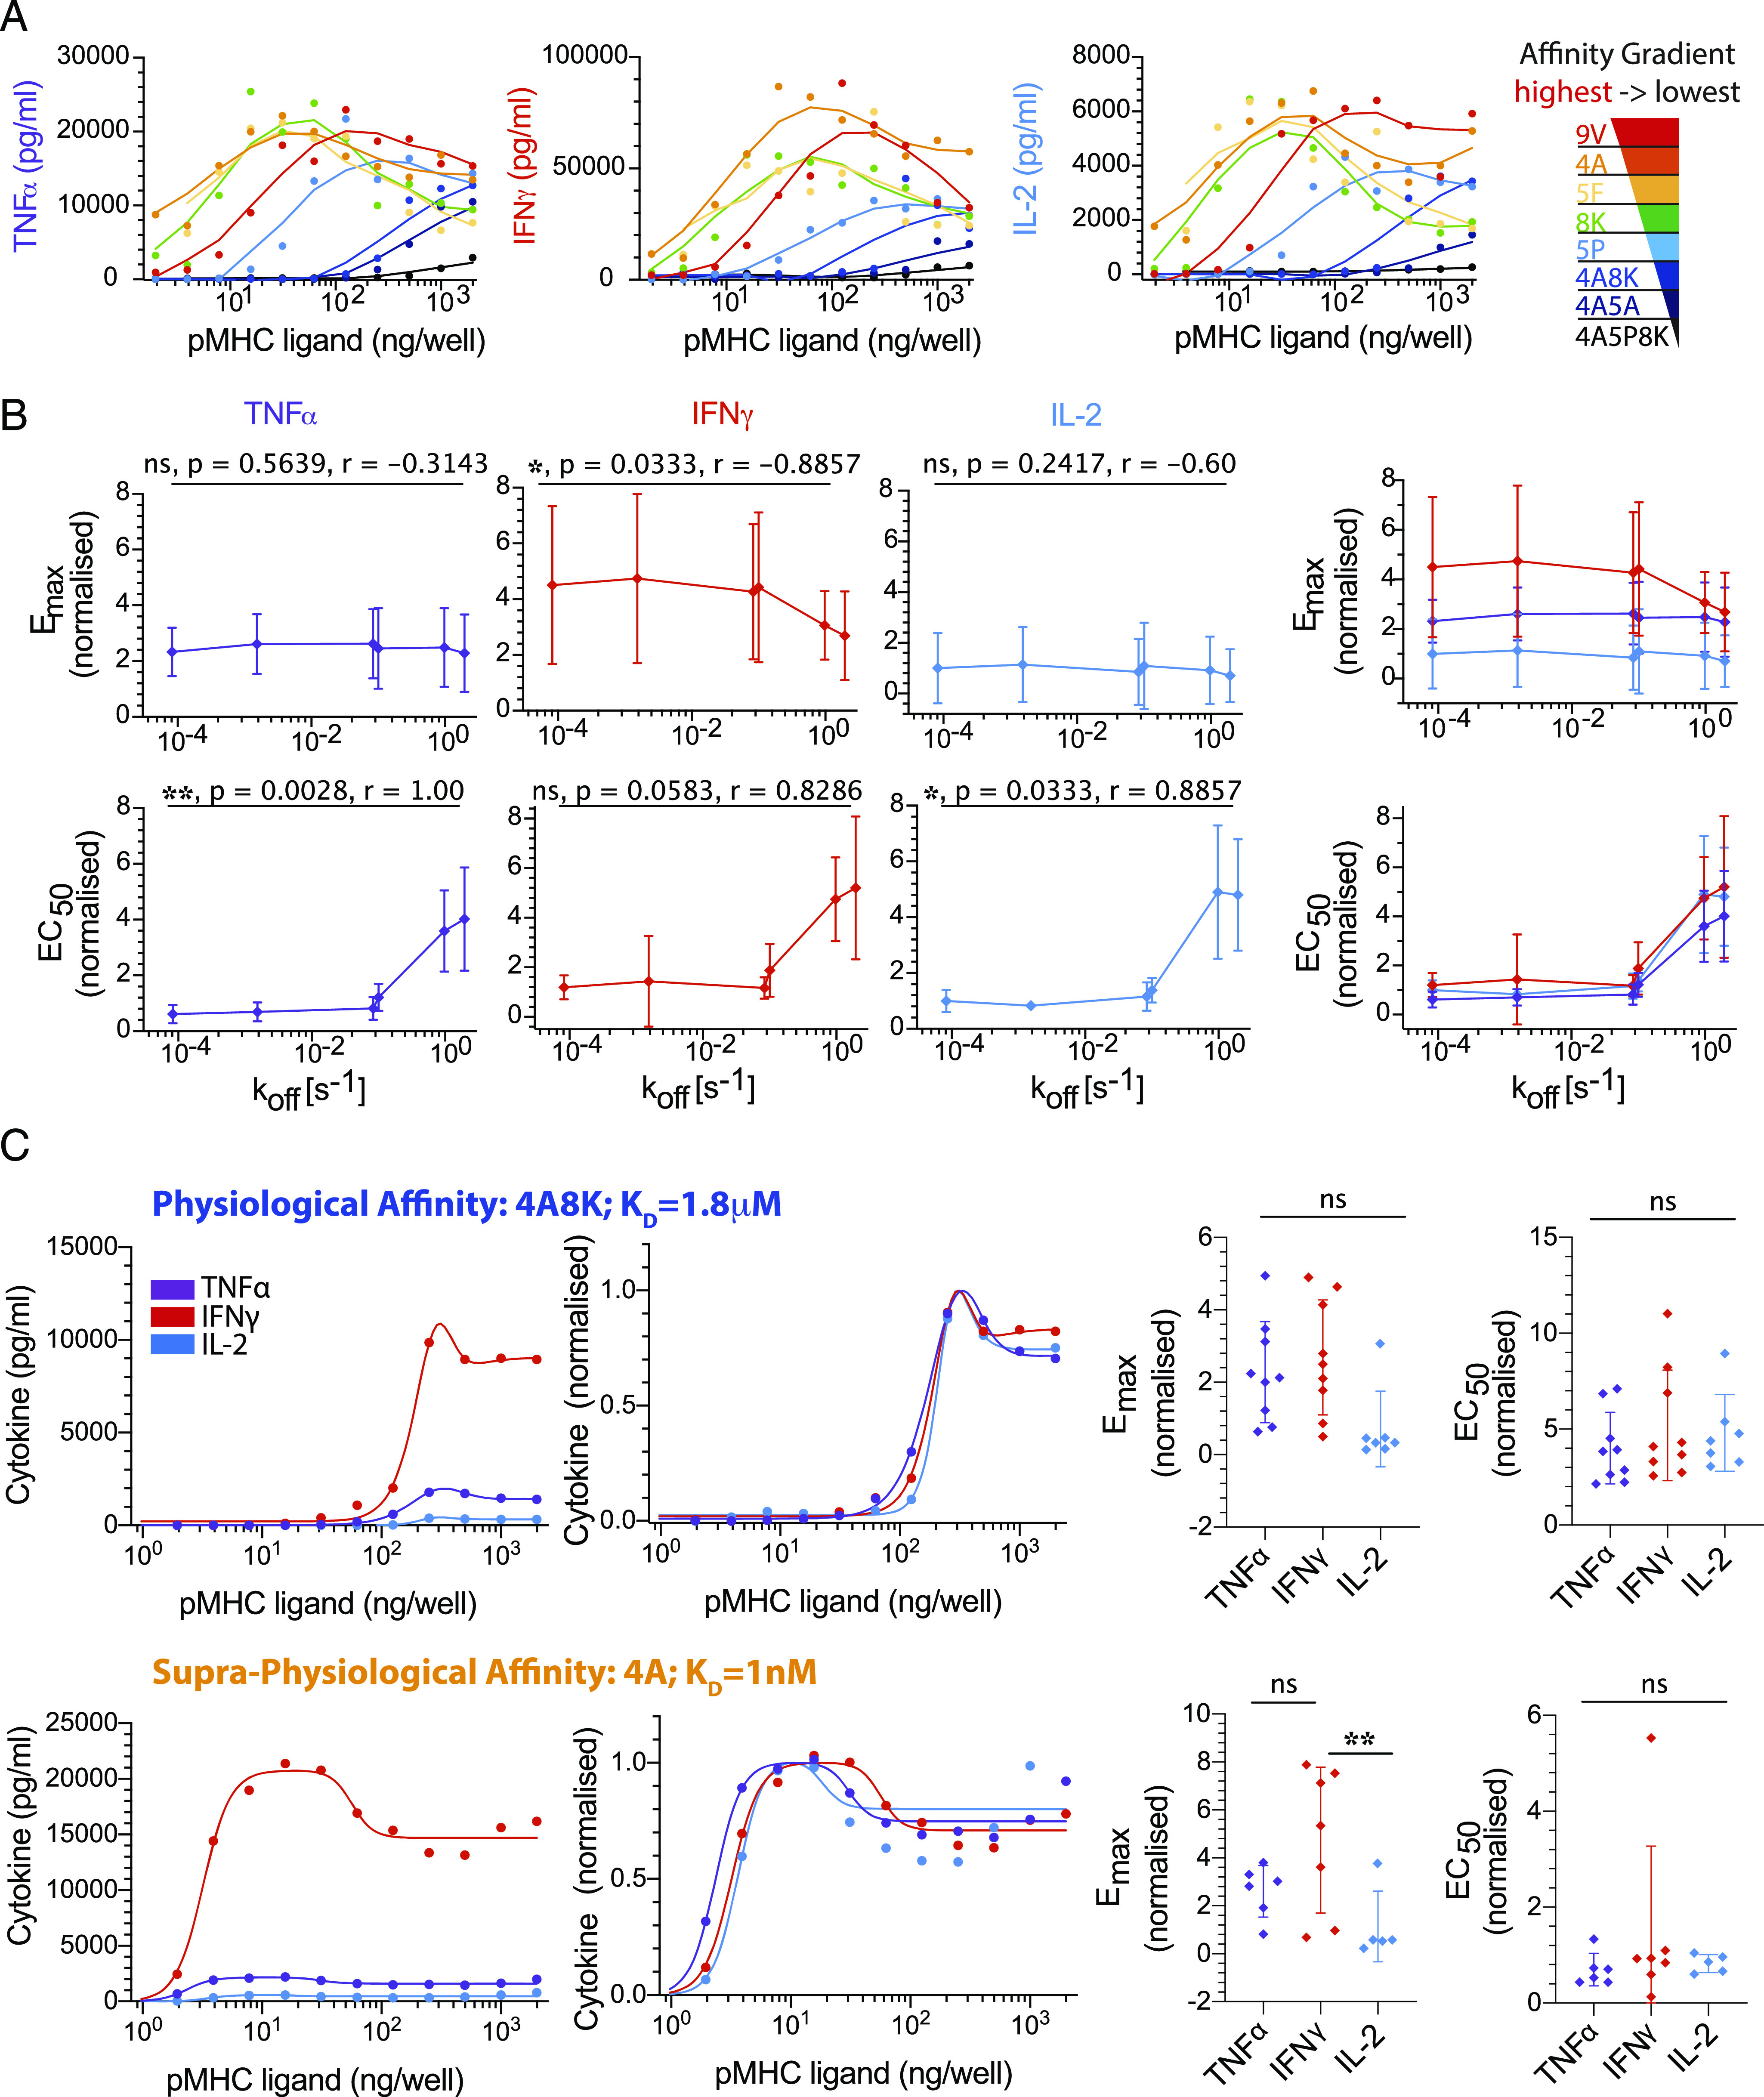
FIGURE 2.

Different cytokines exhibit a comparable Ag dose threshold over a large variation in Ag affinity. (A) Representative data showing supernatant TNF-α, IFN-γ, and IL-2 over pMHC dose for different pMHC affinities (colors). (B) Fitted Emax (top row) and EC50 (bottom row) for each cytokine individually (left three columns) or overlaid (right column) over the TCR/pMHC off-rate (koff) measured at 37°C (Supplemental Fig. 1A). Reliable estimates were not possible for the two lowest affinity pMHCs (4A5A and 4A5P8K), and they were omitted from the quantitative analysis. (C) Representative overlay of TNF-α, IFN-γ, and IL-2 directly (first column) or normalized by their respective Emax value (second column) for a physiological (top row) and supraphysiological (bottom row) affinity pMHC. Dot plots for Emax (third column) and EC50 (fourth column) show the data across nine independent biological repeats with different donors. This analysis highlights that within the resolution of our 2-fold dilutions in pMHC dose, no significant difference is observed between the EC50 threshold for different cytokines. ANOVA corrected for multiple comparisons by Tukey test (**p = 0.002). The normalized dose-response curves for all nine independent repeats is displayed in Supplemental Fig. 2. Error bars are SD of mean. Solid lines in representative datasets are the fits used to extract Emax and EC50. Normalization and data fitting is described in Materials and Methods.
