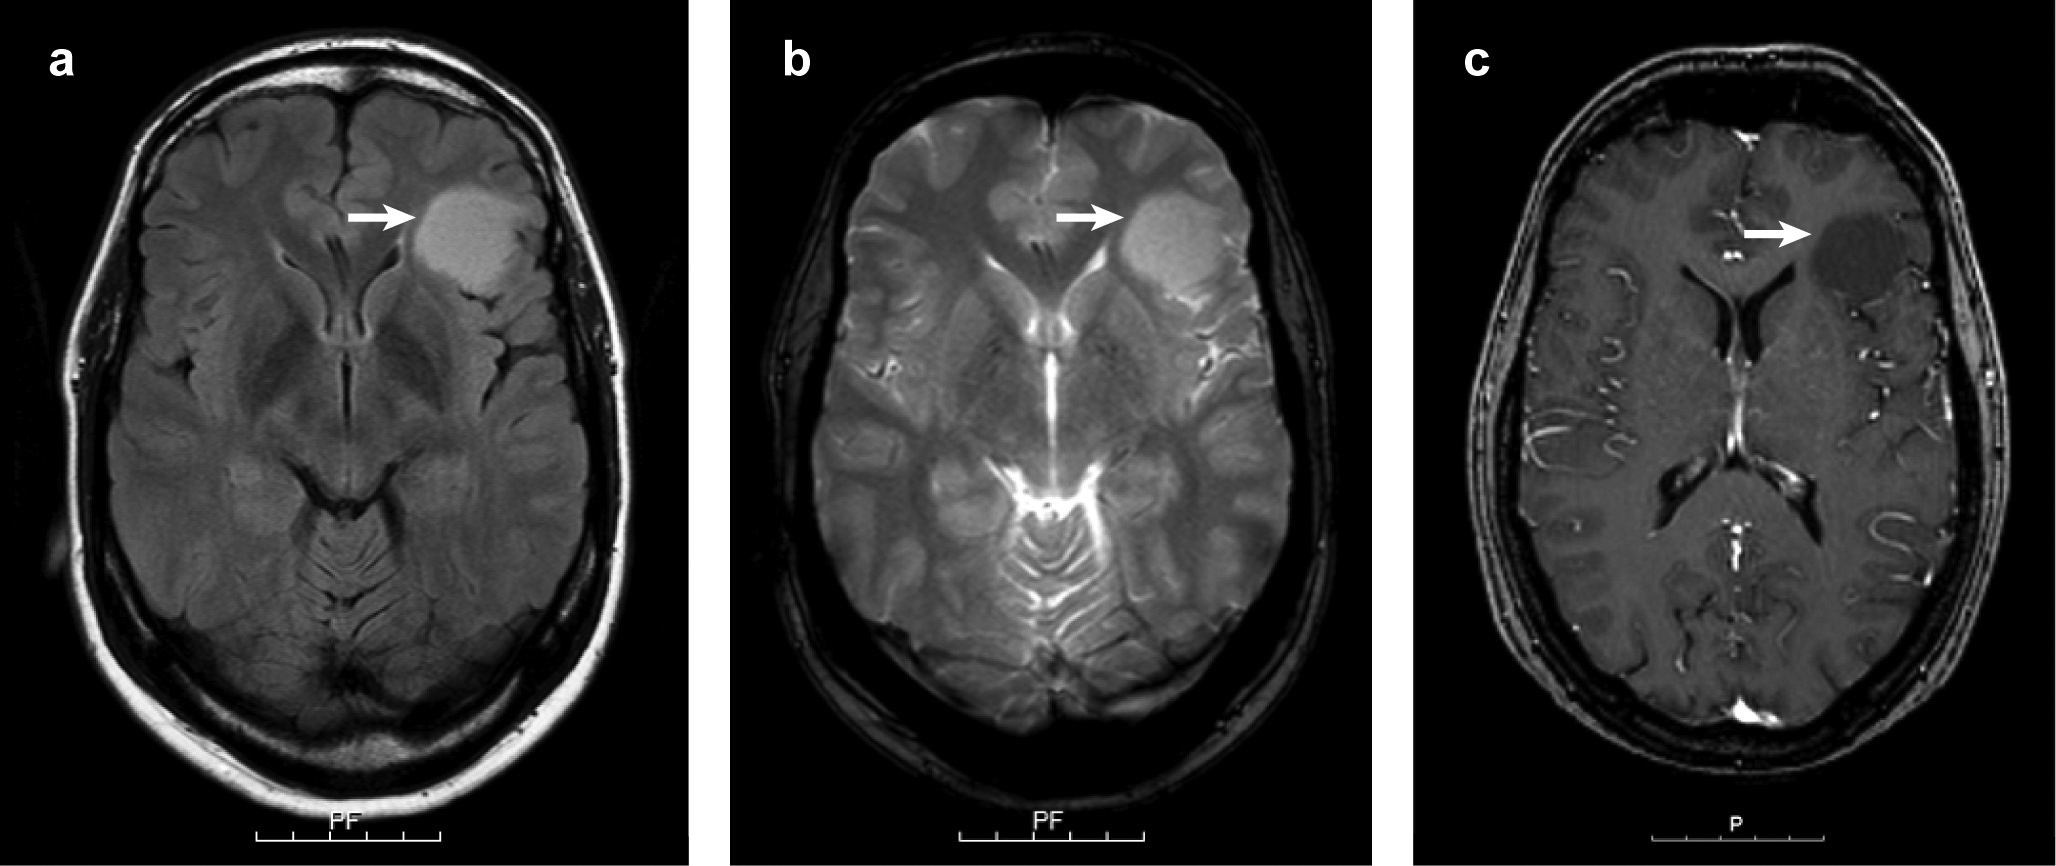
Fig. 2.

Representative MRI images of an isomorphic diffuse glioma. The tumour is hyperintense in FLAIR (arrow in a) and T2-weighted images (arrow in b) while hypointense in the T1-sequence (arrow in c). The tumour did not show contrast enhancement (c). Scale bars 5 cm with 1 cm intervals.
