
Figure 2. Screen for E. coli growth inhibition in M9 yielding N-(phenyl) thioacetamide-linked 1,2,3-triazoles.
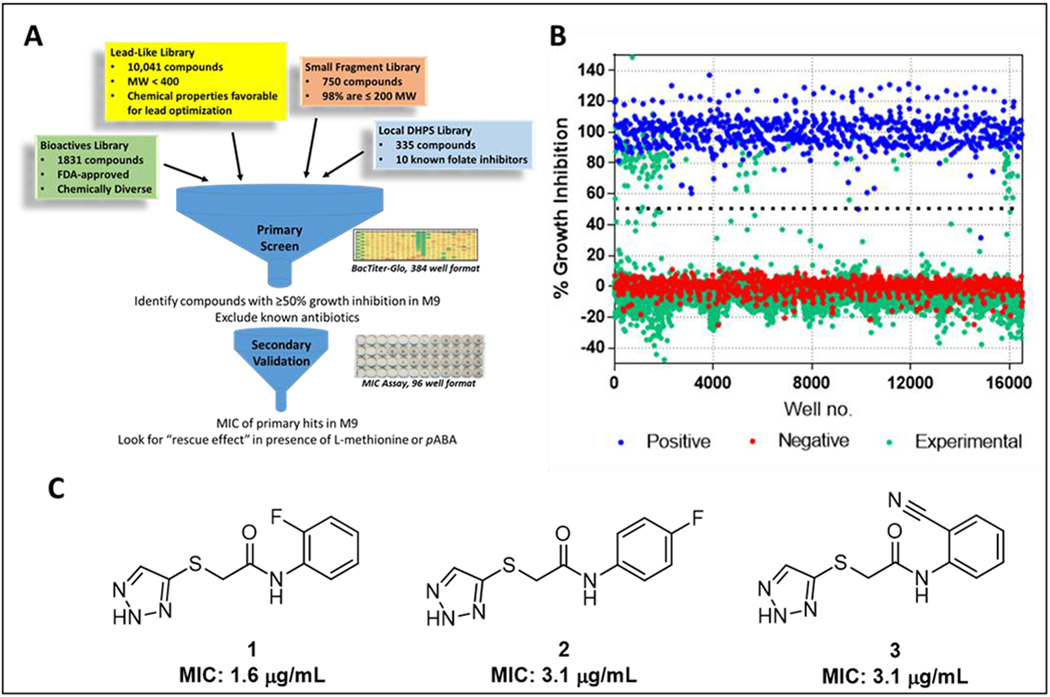
(A) Overall schematic of screen. Testing for antagonization by pABA and L-methionine during secondary validation indicates interaction with pathways related to folate biosynthesis. (B) Scatter plot of all compounds tested. Negative controls (red dots) represent 0.47 % DMSO carrier while positive controls (blue dots) represent 50 μM treatment with chloramphenicol. (C) Chemical structures of three TAT hits from the Lead-Like Library and MIC against E. coli K12 MG1655.