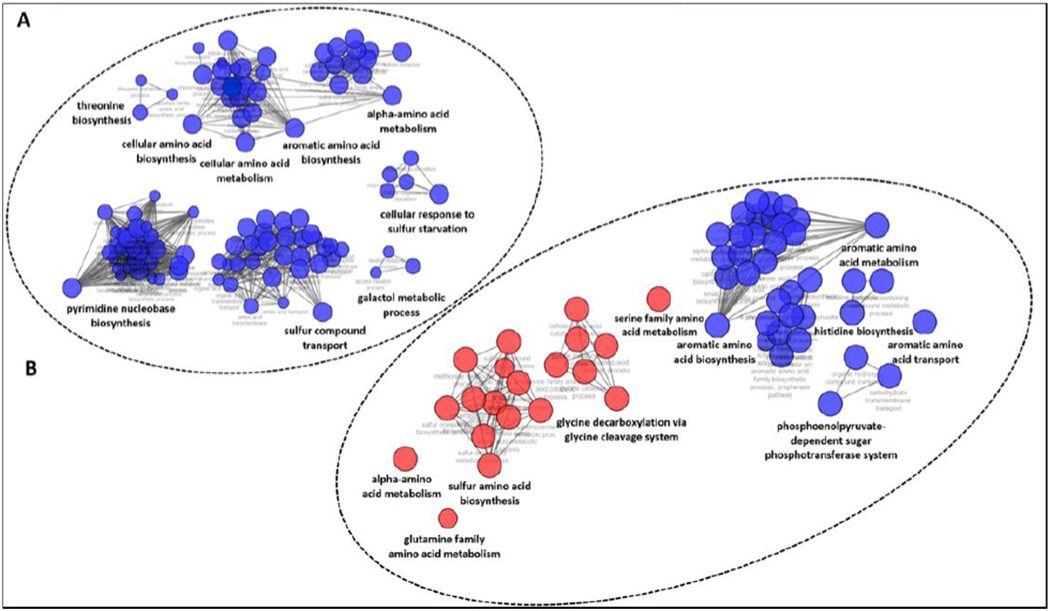
Figure 7. Pathway networks of E. coli RNA-seq analysis of genes transcriptionally altered by compound 1 treatment.

Only genes with at least a 2-fold change in expression and P-value ≤ 0.01 were chosen for the pathway analysis. Blue indicates downregulation and red indicates upregulation. (A) Affected pathway networks after compound 1 treatment in M9T (taurine as the sulfur source). (B) Affected pathway networks after treatment with compound 1 in M9 with magnesium sulfate as the sulfur source. Complete RNA-Seq data are available in NCBI GEO (GSE142164).
