
Figure 4.
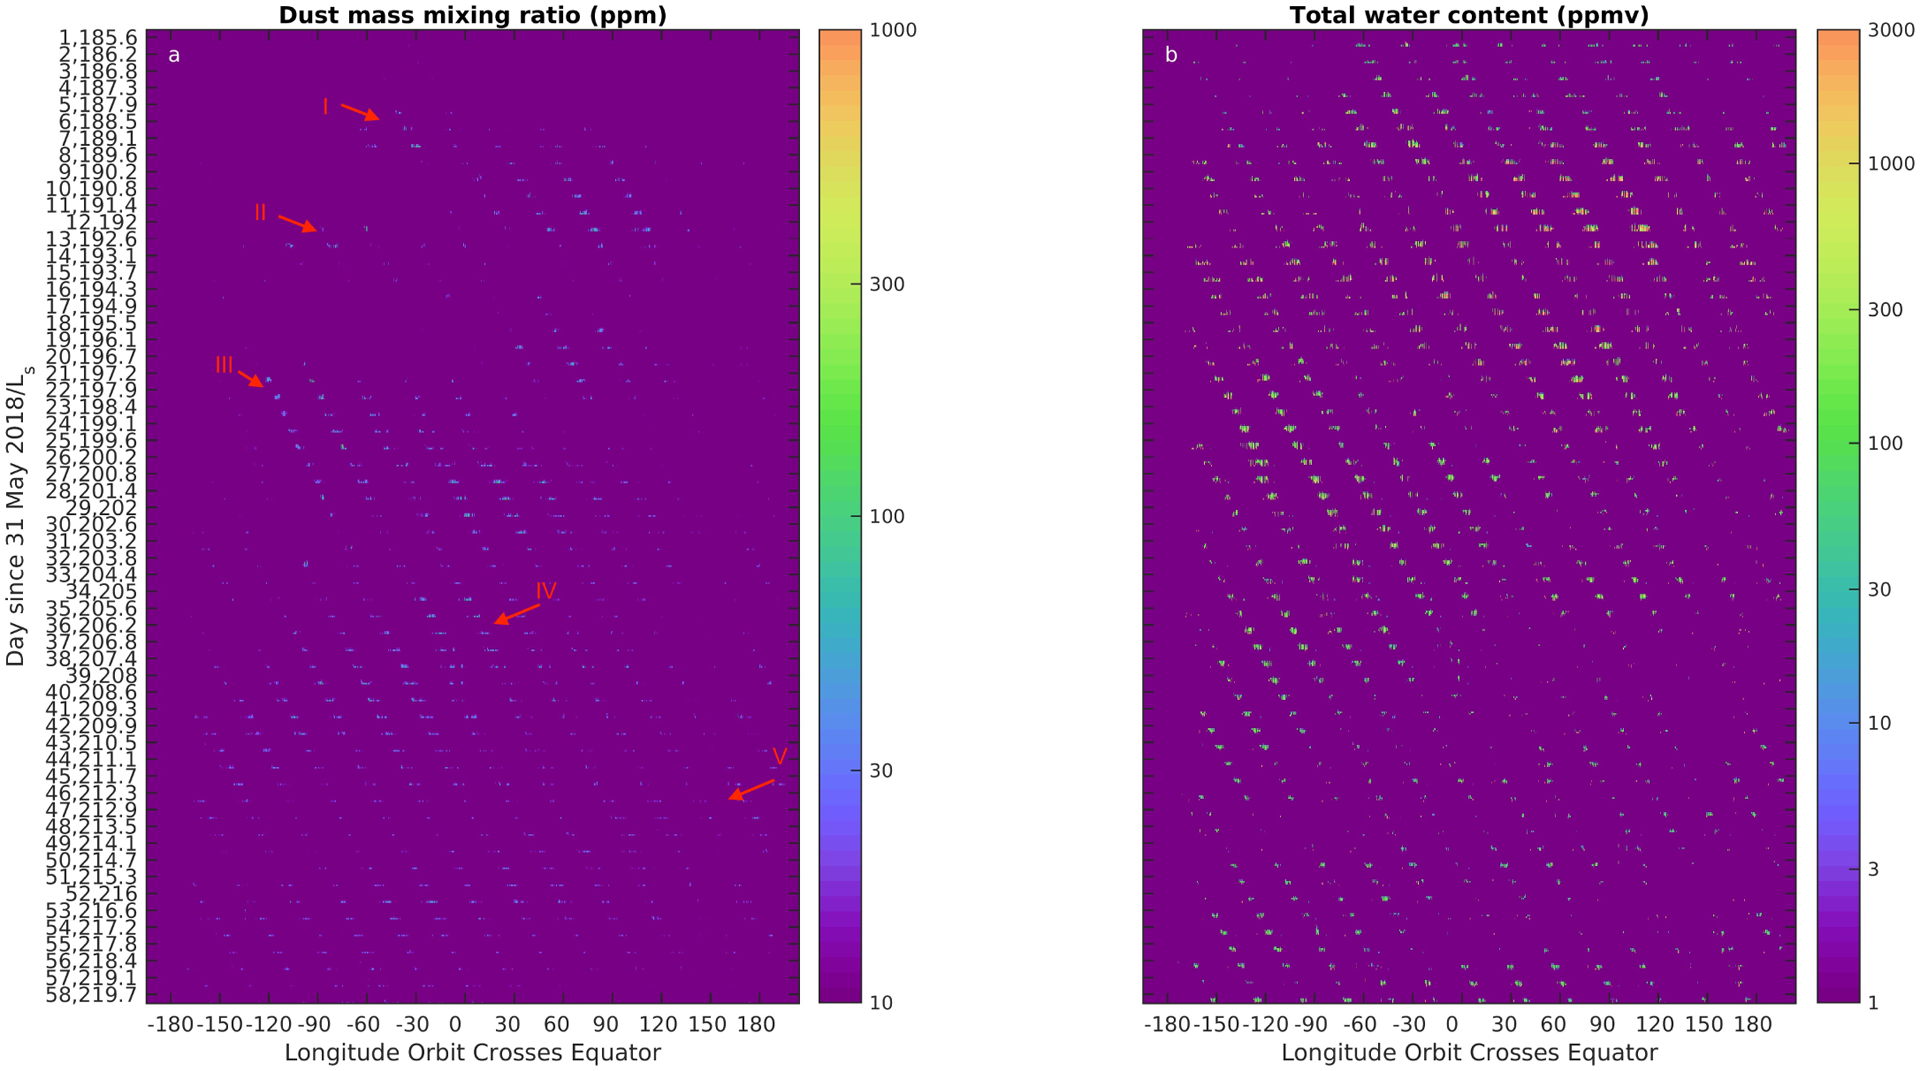
Temporal and longitudinal evolution of dust MMR (ppm) and total water content (ppmv) on the nightside above the 0.1 ms−1 vt contour. Each plot is divided by Earth day since 31 May 2018 (MY 34, Ls=185.05°) into 58 divisions. In each division is plotted the relevant quantity (e.g., dust MMR) interpolated between vt =0.1 ms−1 and 10 ms−1 based on retrievals from in-track observations along each orbit on that Earth day. The data from each orbit is plotted so that data at the Equator is plotted at the central longitude at which in-track observations cross the Equator, more southerly data is plotted up to 10° west of the central longitude, and more northerly data is plotted up to 10° east of the central longitude. Binning of data in an individual orbit is at a resolution of 3° in latitude. Instances in (a) in which deep convection could propagate like a wave are numbered with red Roman numerals near their date and longitude of commencement. The inferred propagation direction is indicated with a red arrow.