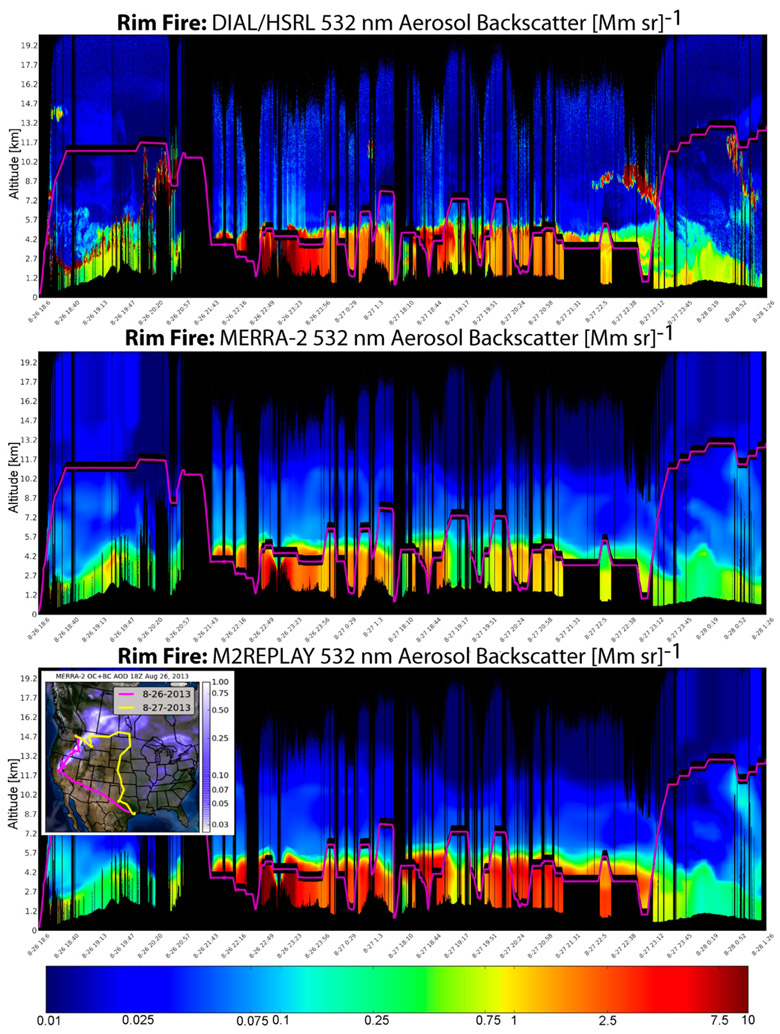
Fig. 10.
Curtain plots of aerosol backscatter coefficient from the SEAC4RS Rim Fire flights (26 and 27 Aug 2013). (top) Observations at 532 nm from the DIAL/HSRL instrument aboard the NASA DC8, with pink lines indicating the altitude of the aircraft. Aerosol backscatter simulated by (middle) MERRA-2 and (bottom) M2REPLAY, where both simulations have been sampled along the flight tracks shown in the inset map.

