Fig. 12.
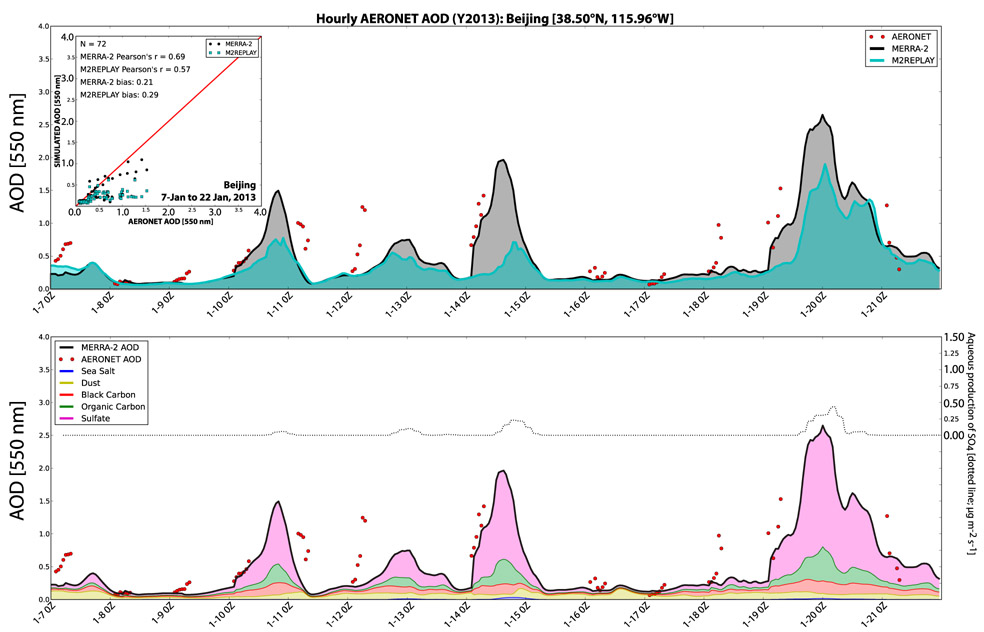
(top) Time series of hourly AOD for the January 2013 Beijing pollution event as observed by AERONET (red dots) and simulated by MERRA-2 (black) and M2REPLAY (cyan). The inset plot shows the statistical relationship between collocated observations and the two simulations (supplemental material shows larger versions of the inset). (bottom) MERRA-2 AOD (black line) and contributions from individual aerosol species (shaded regions). AERONET observations are repeated (red dots). The dotted line (associated with right axis) shows the aqueous production of sulfate aerosol, which coincides with the peaks in simulated AOD.

