Fig. 2.
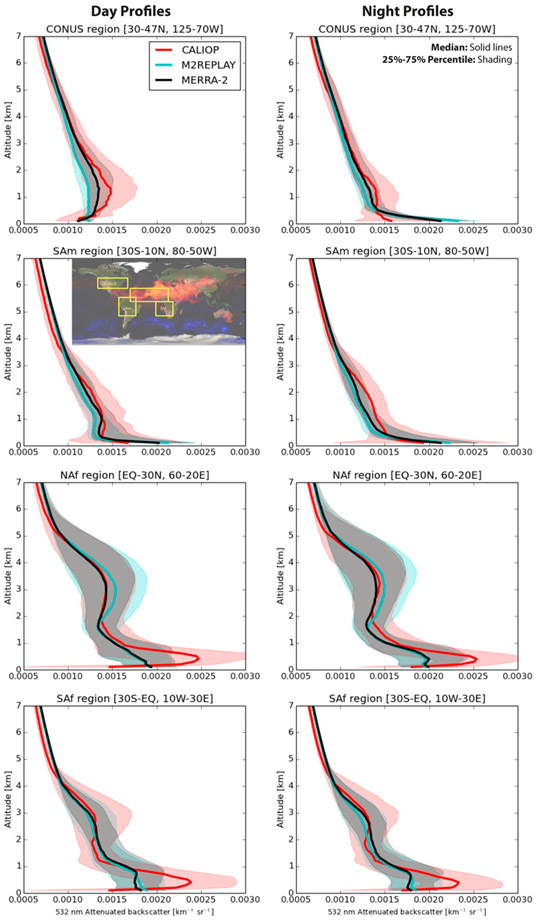
Seasonal (JJA 2008) vertical profiles of CALIOP attenuated backscatter coefficient (km−1 sr−1) at 532 nm and derived from model simulations sampled on the CALIOP path and averaged over (first row) the continental United States, (second row) South America, (third row) northern Africa, and (fourth row) southern Africa. The solid lines are the median of all profiles for CALIOP (red), MERRA-2 (black), and M2REPLAY (cyan) during the (left) day and (right) night. Shaded areas represent the 25th–75th percentile of all modeled and observed profiles. The inset map provides regional definitions.

