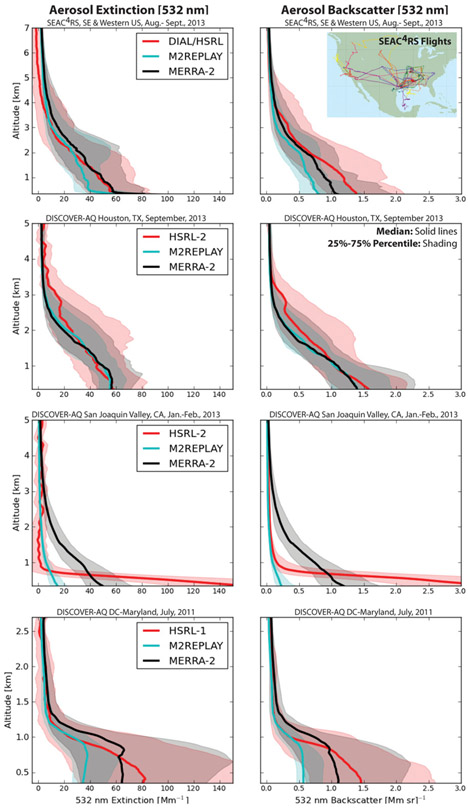
Fig. 3.
Vertical profiles of (left) extinction and (right) backscatter coefficients measured by HSRL instruments and derived from the MERRA-2 and M2REPLAY simulations sampled on the HSRL flight path during U.S. aircraft-based field campaigns. (first row) SEAC4RS (southeastern and western United States, August–September 2013), (second row) DISCOVER-AQ Houston (August–September 2013), (third row) DISCOVER-AQ California (San Joaquin Valley, January–February 2013), and (fourth row) DISCOVER-AQ Baltimore–Washington, DC (July 2011). The solid red, black, and cyan lines are the median of all profiles for HSRL, MERRA-2, and M2REPLAY, respectively. Shaded areas are the 25th–75th percentile of all modeled and observed profiles.

