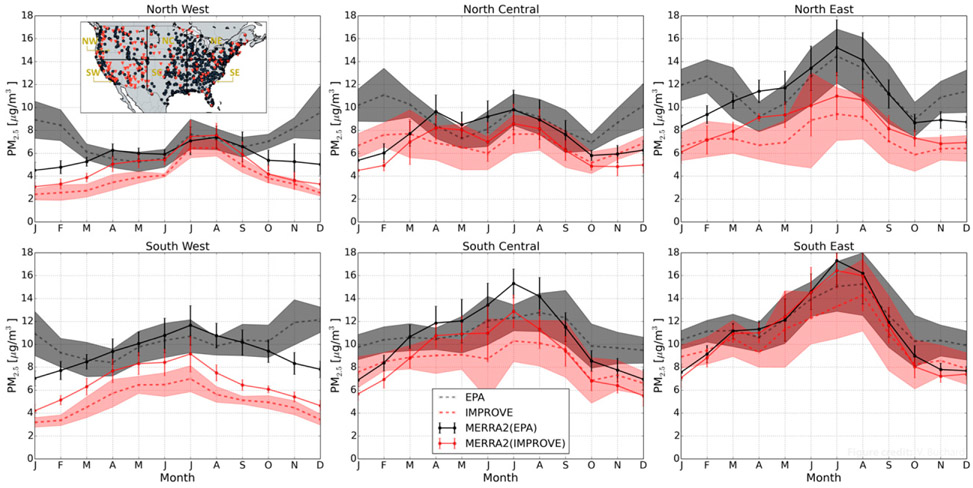
Fig. 5.
Monthly and regional variations of surface PM2.5 (μg m−3) from both EPA-AQS (gray dashed) and IMPROVE (red dashed) networks compared with MERRA-2 PM2.5 sampled at IMPROVE sites (red solid) and EPA sites (black solid) located in the U.S. northwestern (NW), north-central (NC), northeastern (NE), southwestern (SW), south-central (SC), and southeastern (SE) regions over the period 2003–12. Vertical bars are the standard deviations of monthly values calculated from years 2003 to 2012 for the model; shaded area is the same for the observations. The encompassed map shows the location of EPA-AQS (black) and IMPROVE (red) stations and the dividing black lines indicate the six regions considered.

