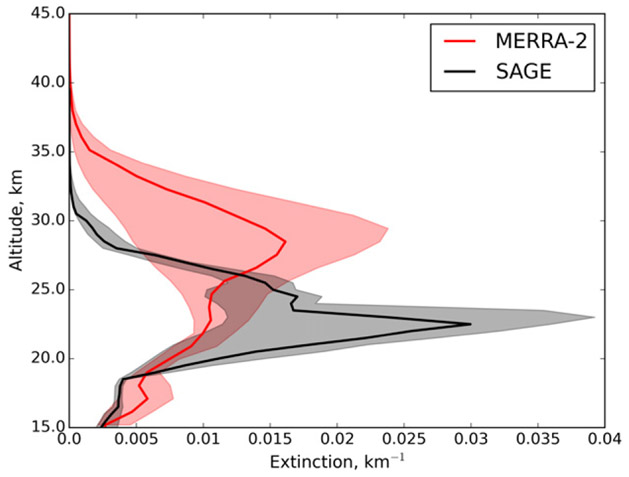
Fig. 6.
Vertical profile of SAGE II (black) and MERRA-2 (red) aerosol extinction averaged over the tropics (20°S–20°N) after the Mount Pinatubo eruption from July to December 1991. The solid lines are the median and shaded areas represent between the 25th and 75th percentiles of all modeled and observed profiles.

