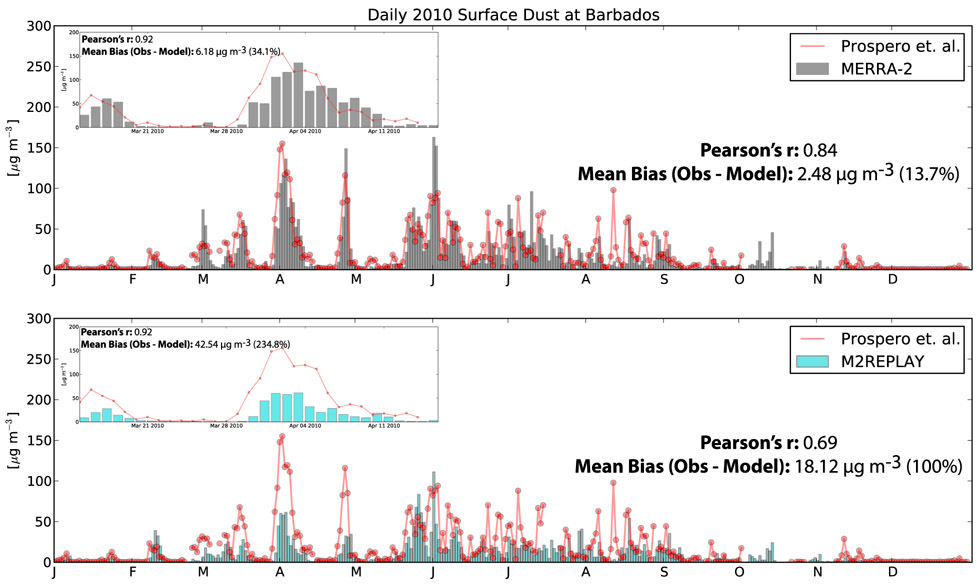
Fig. 9.
Time series of observed (red) daily surface dust (μg m−3) at Barbados in 2010. Simulated daily surface dust from (top) MERRA-2 (black bars) and (bottom) M2REPLAY (cyan bars) is also shown, with statistics given in each panel. Inset plots zoom in on the March–April 2010 dust event (see supplemental material for larger versions of the inset).

