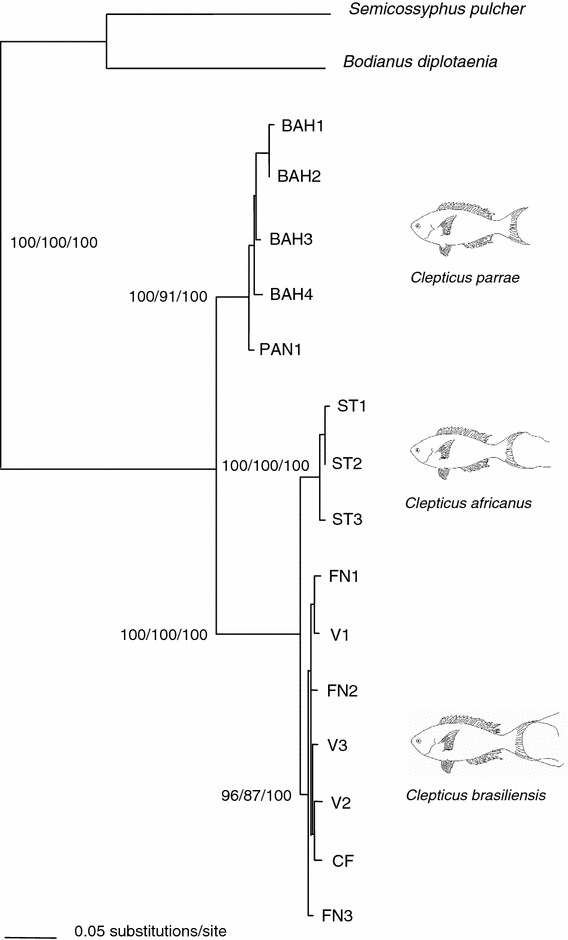
Fig. 2.

Phylogram for the genus Clepticus based on the mitochondrial control region, cytochrome b and 16S genes. Bootstrap support values are show for neighbour-joining/maximum parsimony/likelihood, respectively. Origin of samples is indicated by labels as in Table 1
