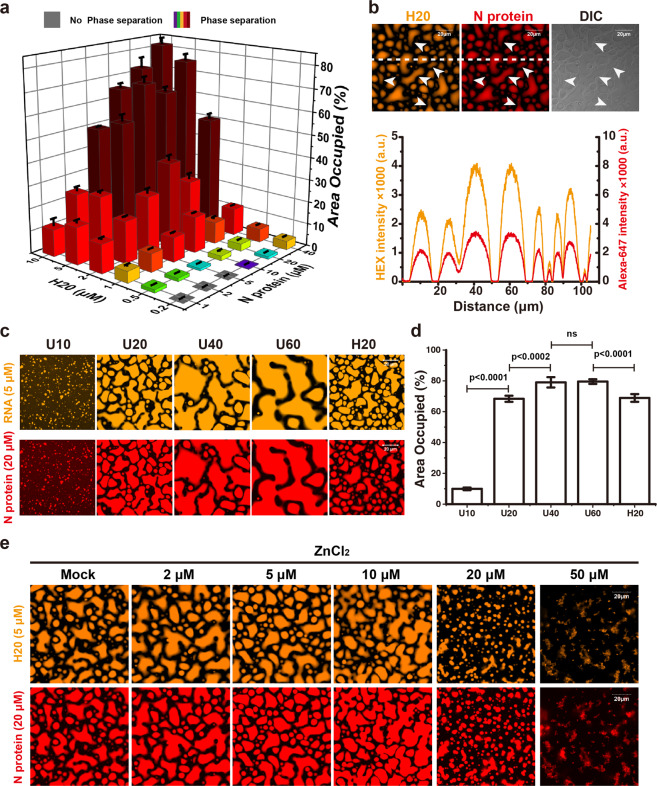
Fig. 1. N protein of SARS-CoV-2 undergoes LLPS with ssRNA in vitro.
a Phase diagram of a 20-nt RNA H20 separating with N protein of SARS-CoV-2. The histogram shows the percentage of area occupied by N protein/H20 droplets. b Upper panel, representative fluorescence and DIC images of LLPS droplets formed by H20 RNA (orange) and N protein (red) after 1-h mixing. White arrows indicate ongoing fusion events. Bottom panel, fluorescence intensity profiles of two fluorescence channels (H20 RNA, orange; N protein, red) along the white dashed line in the upper panels. c The length of ssRNA modulates the N protein/RNA LLPS. Representative fluorescence images of HEX-labeled ssRNA (orange, 5 μM) of different lengths forming phase-separated liquid droplets with Alexa-647-labeled N protein (red, 20 μM). d Comparison of the percentage of area occupied by droplets in each field of view in c. e Zn2+ promotes N protein/RNA LLPS. Representative fluorescence images of Alexa-647-labeled N protein (20 μM) mixed with H20 RNA (5 μM) to form phase-separated liquid droplets in the presence of the indicated concentrations of Zn2+. Scale bars, 20 μm. Error bars refer to SD of five independent experiments.

