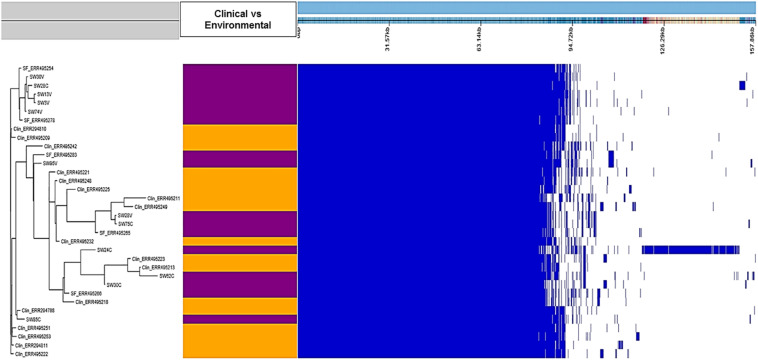
FIGURE 3.
Presence–absence map of the genes in the pangenome of clinical and environmental S. Weltevreden. The tree to the left is the accessory binary tree where environmental strains are marked with purple whereas clinical strains are shown in orange color. The blue box marks the presence of a region whereas the white gaps represent the absent regions.

