
Figure 4. Exhaustion of affinity-tuned CD38-CAR T cells.
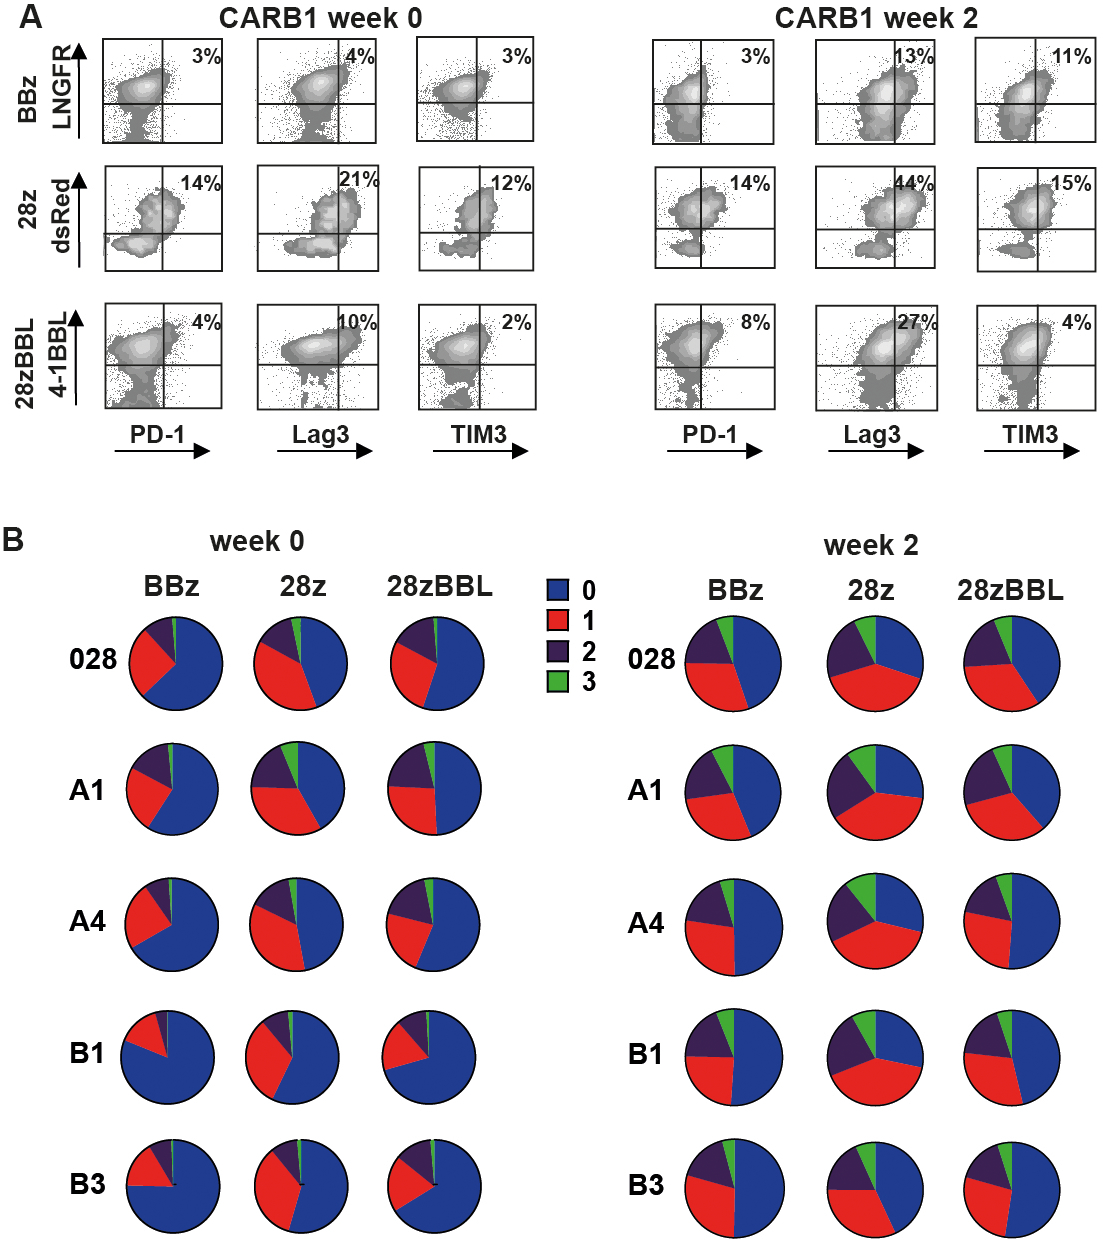
(A) Flow cytometry density plots illustrating expression of inhibitory receptors PD-1, Lag3 and TIM3, 2 weeks after stimulation with 3T3-CD38. Representative figure of 3 independent experiments. (B) Pie charts illustrating the % of cells expressing either 0, 1 (PD-1+, Lag3+ or TIM3+), 2 (PD-1+/Lag3+ or PD-1+/TIM3+ or Lag3+/TIM3+) or 3 (PD-1+, Lag3+ and TIM3+) exhaustion markers gated on live CD3+CAR+ cells. Mean values of n=3 are shown.