
Figure 5. Very low-affinity CD38-CAR-T cells with 28z and 4–1BBL costimulation show better tumor control and persistence in vivo.
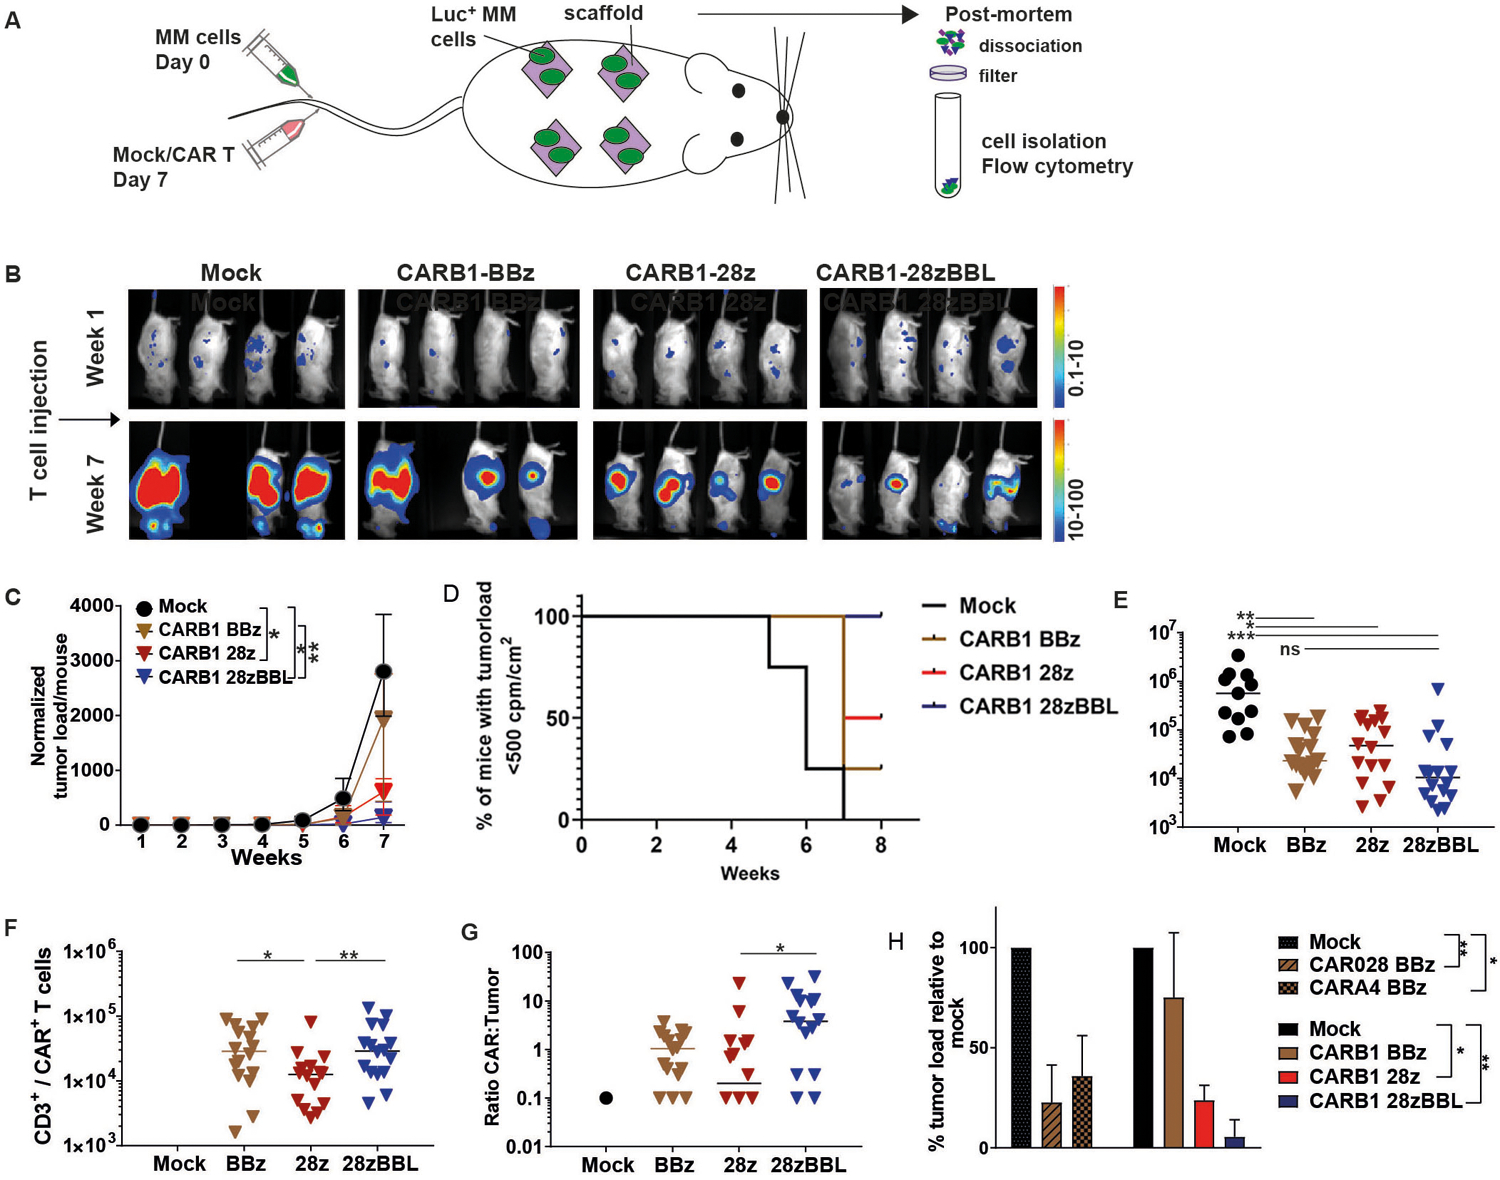
(A) Schematic of in vivo experimental set-up. Scaffolds consisting of three 2- to 3-mm3 triphasic calcium phosphate particles coated in vitro with human mesenchymal stromal cells were implanted subcutaneously in RAG2−/−γc−/− mice. 8–12 weeks later, mice were i.v. injected with 10×106 cells of luciferase-transduced UM9 cells. One week after tumor injection mice were treated with i.v. injections of 5×10⁶ mock, CD38-CARB1 BBz, −28z or −28z-BBL T cells. (B) Representative bioluminescence images (BLI) are shown n=4 per group for week 1 and 7 (all BLI images in Figure S4). (C) Quantification of BLI measurements, normalized to week 1. Each group contained 4 mice and each mouse harbored 4 scaffolds (n=4). Indicated are the median values of normalized tumor load per group +/− range, * indicates p value <0.05, and ** <0.01 using Kruskal-Wallis analysis of variance. (D) Kaplan-Meier curve based on the set up of a maximum BLI measurement. In our model BLI measurement reaches a plateau after between 8 weeks without the tumor being lethal for the mice. Therefore we have chosen week 7 as the end point of our experiments. This plateau roughly corresponds with 500 cpm/m2. Thus we considered this BLI value as the potential human endpoint of the experiment to obtain a Kaplan-Meier curve. (E, F, G) Post-mortem analysis of scaffolds harboring UM9 tumor cells and infiltrated T cells. Scaffolds were dissociated and filtered through a 70μm filter. Single cells were stained for mouse and human CD45, counted and analyzed by flow cytometry. (E) Absolute numbers of MM cells (GFP+/CD138+). (F) Number of CAR-T cells (CD45+/CD3+ and LNGFR+ or dsRed+ or 4–1BBL+). Mock <103 T cells. (G) Ratio between CAR T cells and MM cells. N=4, results are median cell number of 16 scaffolds (4 per mouse) +/− range. (H) Since tumor growth was similar for the mock treated group between experiments and tumor load between treatment groups was equal before CAR T cell injection, we normalized BLI measurements to mock control values and compared data to previous experiment15. Displayed is the median of relative tumor load (quantified BLI measurements) at week 7, relative to mock (set at 100%), n=4 mice. * indicates p value <0.05, ** <0.01, ***<0.001 using Kruskal-Wallis analysis of variance.